Engineering Process Injection Detections - Part 2: Data Modeling
Introduction:
During Part 1 of this blog series: Engineering Process Injection Detections — Part 1: Research, I covered how you can maximize your detection efforts by following a concept outlined by Jared Atkinson: Capability Abstraction. Moving forward, we will focus on the post-attack phase and how to isolate events to create relationships. This process can become difficult if we don’t know what type of data to look for. Conducting research to build an abstraction map before an attack should get us a majority of the way there in terms of knowing what type of data to target for detection. However, as a result of an attack, there may be data generated that occurs indirectly. The data we expect to see might not be spot on, however, it points us in the right direction so that we don’t get lost in the logs. This is when we would want to go through the process of isolating our events, do some analysis, and create relationships between our attack and the data that fired.
Direct vs. Indirect Behavior:
In a future blog, I will be discussing Direct vs. Indirect behavior in-depth. However, in this post, I reference these terms a lot and would like to briefly define their meaning for context.
Direct: An explicit result of a specific activity. Data that an attacker has control over.
Indirect: An implicit result of a specific activity. Data that an attacker does not have control over.
Example:
**Action: **Adversary spawns cmd.exe from powershell.exe:

Direct Result: When spawning cmd.exe from powershell.exe, you get a process creation event (Sysmon Event ID
/Windows Security Event ID: 4688). Within these events, you will see that powershell.exe is the parent process of cmd.exe and there was an event creation of cmd.exe.**Indirect Result: **Behind the scenes of this process creation event, powershell.exe will call a documented API: CreateProcessW. **CreateProcessW **will, in turn, call an undocumented API: NtCreateUserProcess, which will then interact with a system call to send signals to the kernel letting it know it wants a process created. The adversary didn’t explicitly call CreateProcessW in this example or NtCreateUserProcess, due to the execution process leveraged in this example, these extra steps occur.
Note: The above scenario is a very simple example; however, it’s a good idea to see what additional data sources might exist that aren’t immediately exposed by tooling
Data Analytics:
Within this post, we will be utilizing data modeling to create relationships between different events and data attributes. As we move through this process, it is good to remember, we are not creating an analytic logic quite yet. Before moving too deep into this process, it would be good to define what data analytics is and the different components that are within it.
When creating analytics we are taking our data and correlating/massaging it in a way to give us higher context and understanding. Analytics can be broken down into many pieces, however, the three parts I want to focus on are modeling, manipulation and logic. In order for an analytic to be meaningful, a process called “standardization” must be applied to the data.
Standardization is the process of normalizing data elements. In this context, it specifically refers to the process of making sure that two or more data sources are using the same meta-data flags when referring to the same piece of data.
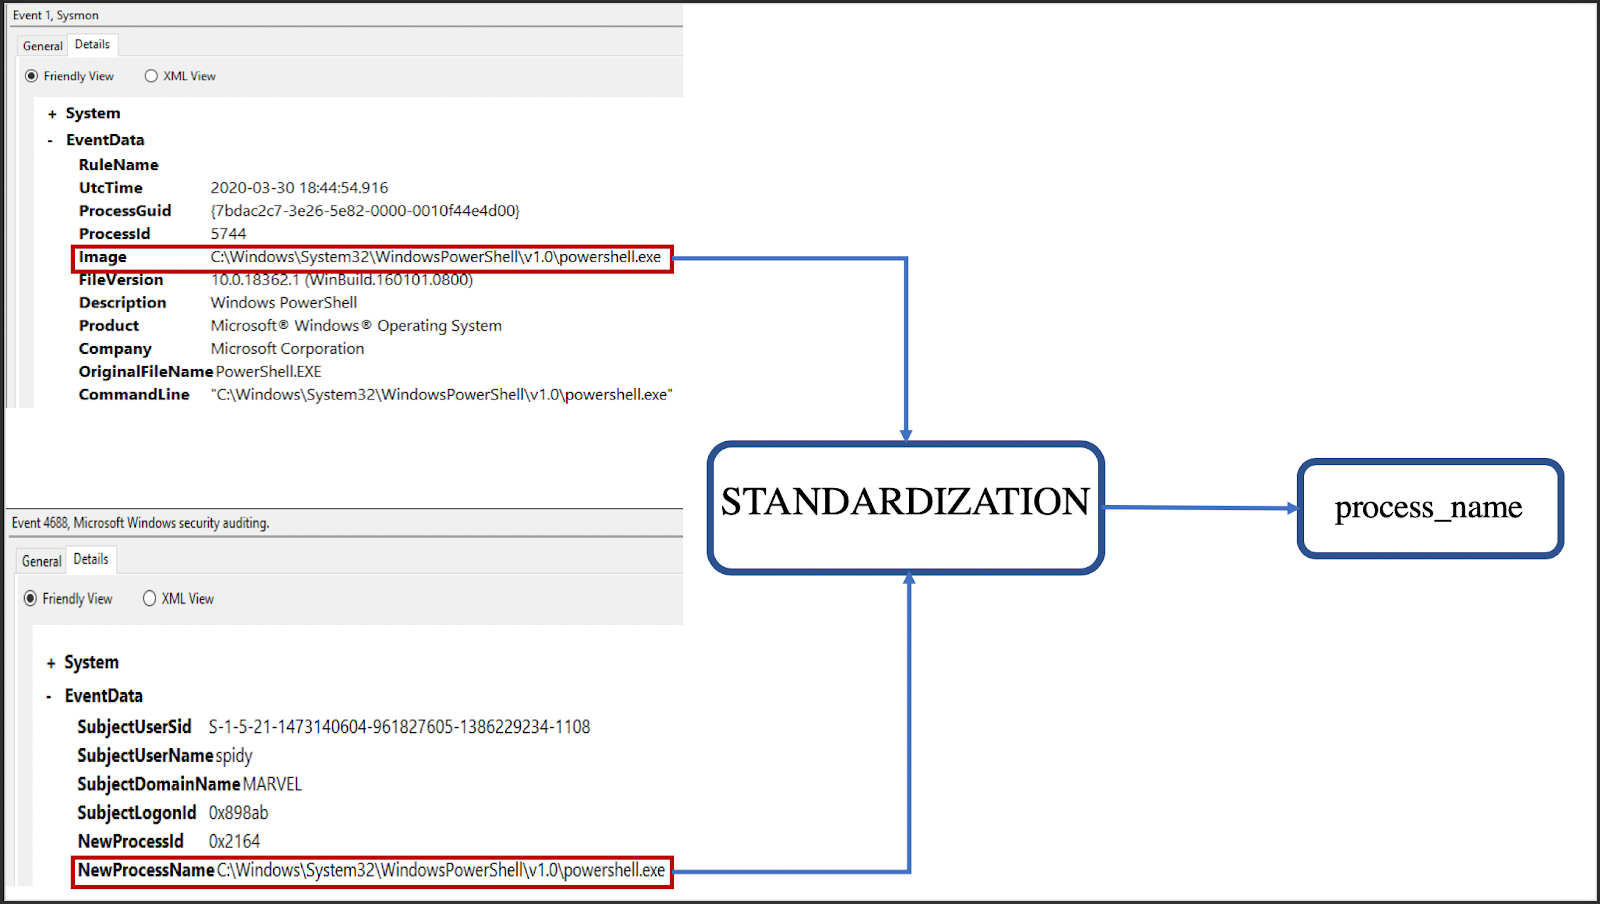
In the example above, we can see that the Windows Security Event ID: 4688 -Process Creation and Symon Event ID: 1- Process Creation have different data fields. Since we want to leverage both log sources in our analytics, we need to standardize the data we’re indexing. In the above example, both the “Image” tag and the “NewProcessName” tag refer to the same piece of information. We can either pick one tag and normalize all others to it or normalize all to our own tag (process_name in this case).
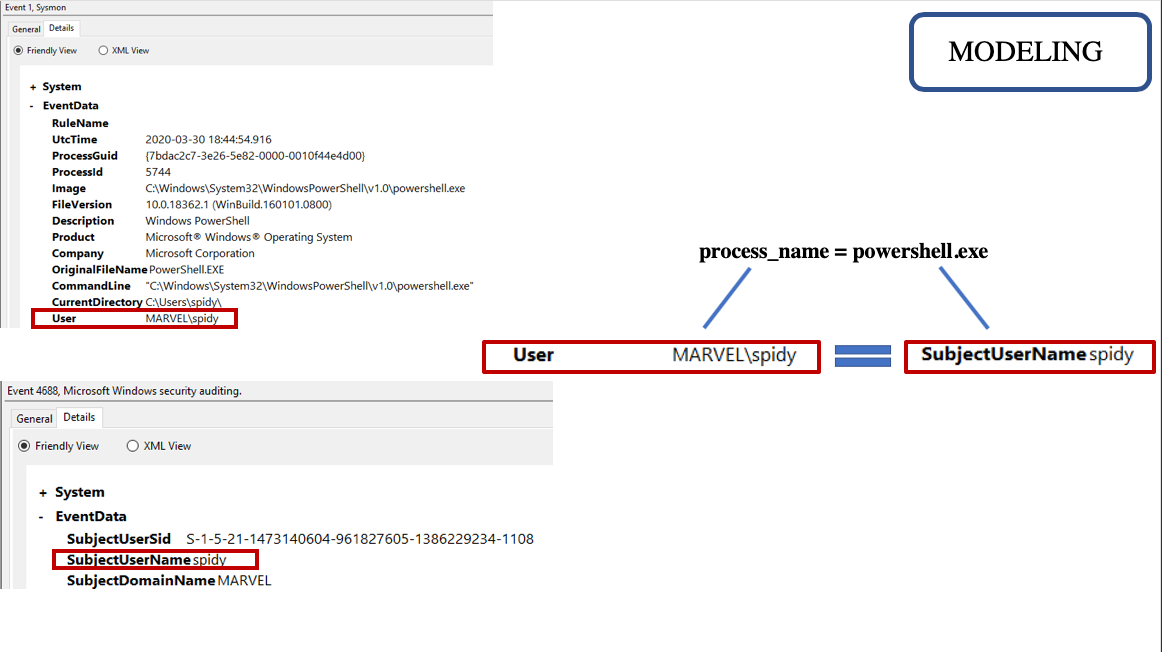
During modeling, the goal is to extract attributes of the data that we have found to be useful when wanting to create relationships for the analytics piece. This is typically done right after the attack test. Modeling is a “pre-analytic logic” step that when done correctly saves time and expands our knowledge of the attack from a data perspective. Modeling takes collected data that have similar attributes, such as Usernames, Process GUIDs, Process Names, etc. and brings them together to create relationships. Keep in mind, these models will be used in the next step of the process when you are defining your analytic logic. Also, this modeling process can help reveal the different approaches we can take towards detecting our target technique. At what point on the Detection Spectrum do we want it to be?
**Note: **If you are not familiar with the concept: Detection Spectrum. Richie Cyrus and Jared Atkinson wrote a great article on this concept that defines what the detection spectrum is and how detections that are built live somewhere on the spectrum. I will refer to their blog throughout this process, so I highly recommend reading his article first to understand the different areas of the spectrum that detections can be tailored to, as well as the benefits and drawbacks to each area.
Once we have created relationships within our data and modeling is complete, we have an idea where we want our detection to be on the spectrum, we then move to manipulation and logic. These two processes can go hand in hand but it would still be good to define both of these concepts:
Manipulation is when you are taking the data you have and forging it to either your environment or other data sources so that you can merge them together for the modeling and logic piece. The metadata of and/or the data itself is being changed. Manipulation allows you to change data attributes so that you can search across many different data sources at one time. Typically this process is done on the fly within the analytic logic. Let’s take a look at an example where we want the process path to equal the process name. During the modeling process, we found that we could join Sysmon Event ID 1’s process name with Windows Security Event 4688’s process path. Within the standardization process, this transform didn’t take place where we would get the same values for each event. One thing we can do is manipulate the 4688 event’s process path by using ***LOWER(substring_index(b.process_path, ‘\\’, -1)) ***to take away the path and give us the process name by itself. This would allow us to make this JOIN.
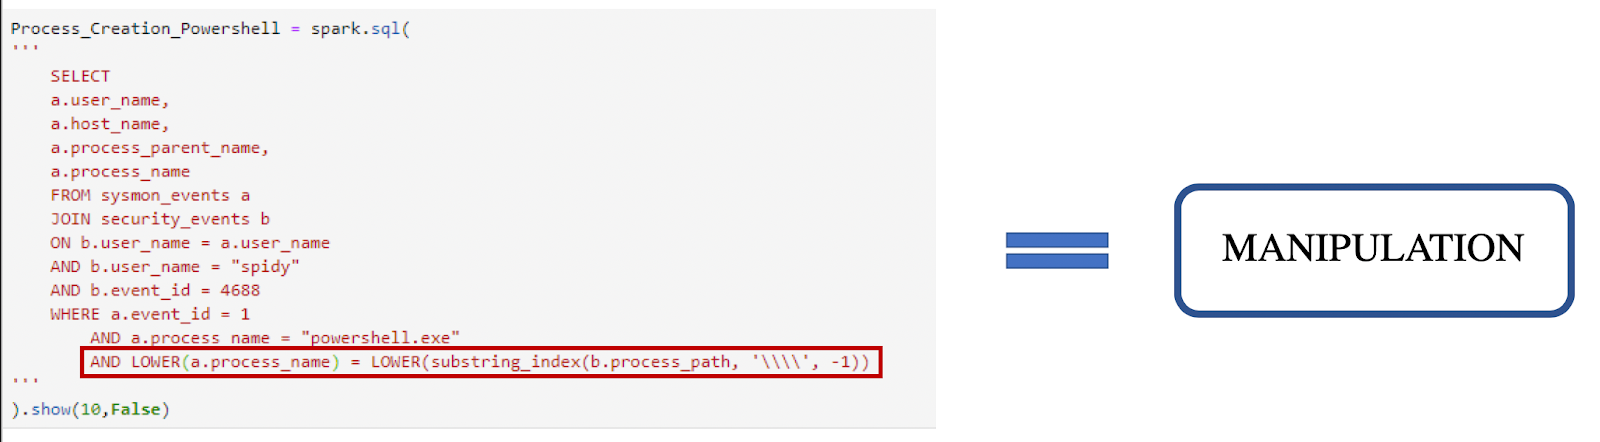
Above shows the operation needed to remove the backslashes and other information of the process path to give us the process name by itself to make the JOIN on the other process name. This can be thought of as “data context normalization”. Taking one attribute that typically isn’t meant to fit another event or attribute, manipulating it so that it does. Manipulating the data allows us to utilize the data that is there in different forms so that we can get back the results we would like to see. Keep in mind however, this doesn’t have to happen for every analytic logic. In fact, we can create this logic without this manipulation. Once this process is done, we move into data modeling.
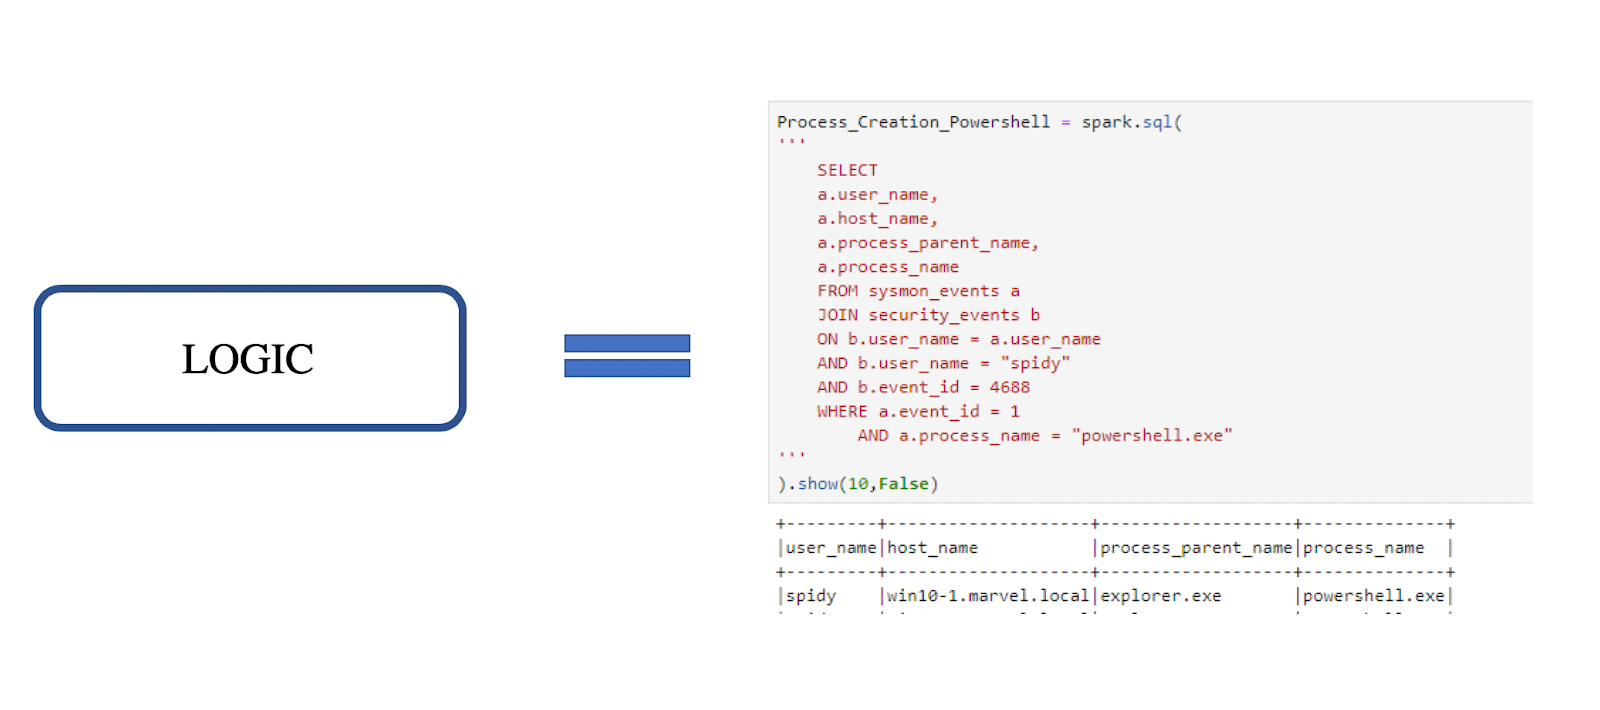
The analytic logic is when you take the models you have made and turn them into a query or an alert for your environment. Analytic logic can be used for detection, triage, or investigation.
The process flow looks like the following:
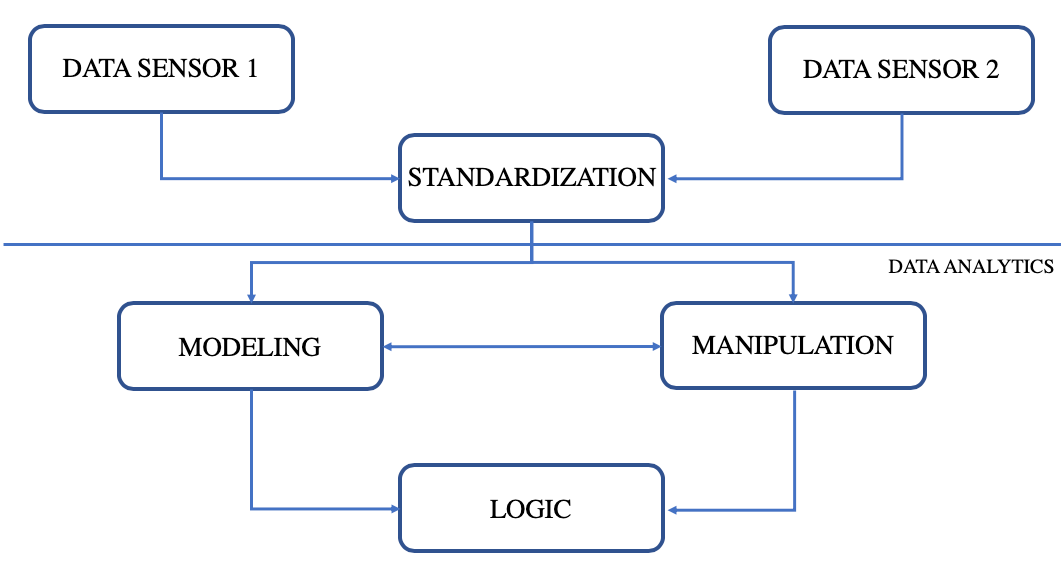
After understanding these concepts it is important to note that this blog will only focus on how to isolate our events and the model piece. Part 3 of this blog will focus heavily on logic and how we manipulate our data to get the analytic logic we would like.
**Note: **During this part of the blog, we will continue to look at the technique: **Process Hollowing, **as we did in the previous blogpost.
Isolating events:
When going through the detection process I often want to perform the attack that I am trying to analyze, that way I can see what type of data was generated as a result of the malicious activity. This allows me to understand what data may be useful in detecting the technique — whether it is directly or indirectly generated. However, before I can start to create models within the data, I have to isolate my attack data from the other data within my environment.
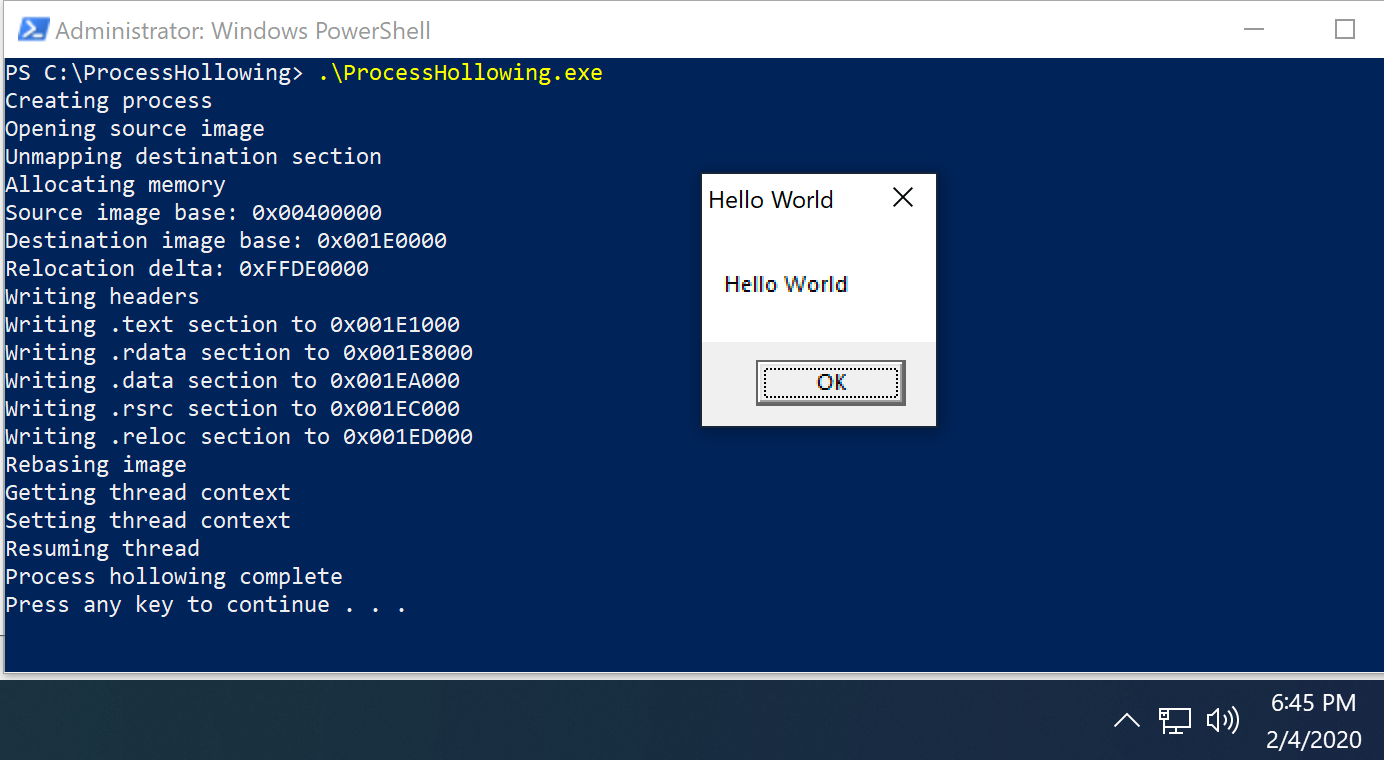
- First I want to run the attack and make note of what I executed:
Note: Thank you to Dwight Hohnstein for this POC.
Above I am running a ProcessHollowing.exe, which is going to:
- Create a process in a suspended state: svchost.exe
- Unmap a section of memory
- Allocate that part of memory
- Write to HellowWorld.exe to the allocated section of memory.
- Call ResumeThread allowing HelloWorld.exe to be called
**Note: **HelloWorld.exe would be the “malicious” code in this instance.
After execution, I want to take note of what was executed, the command line arguments, the time for which the attack was run, and any other specifics about this event.
The process for isolating events can become somewhat tricky, as the method that is typically used is solely up to the person performing the analytics. The following are typical methods I have found helpful during the Isolating process:
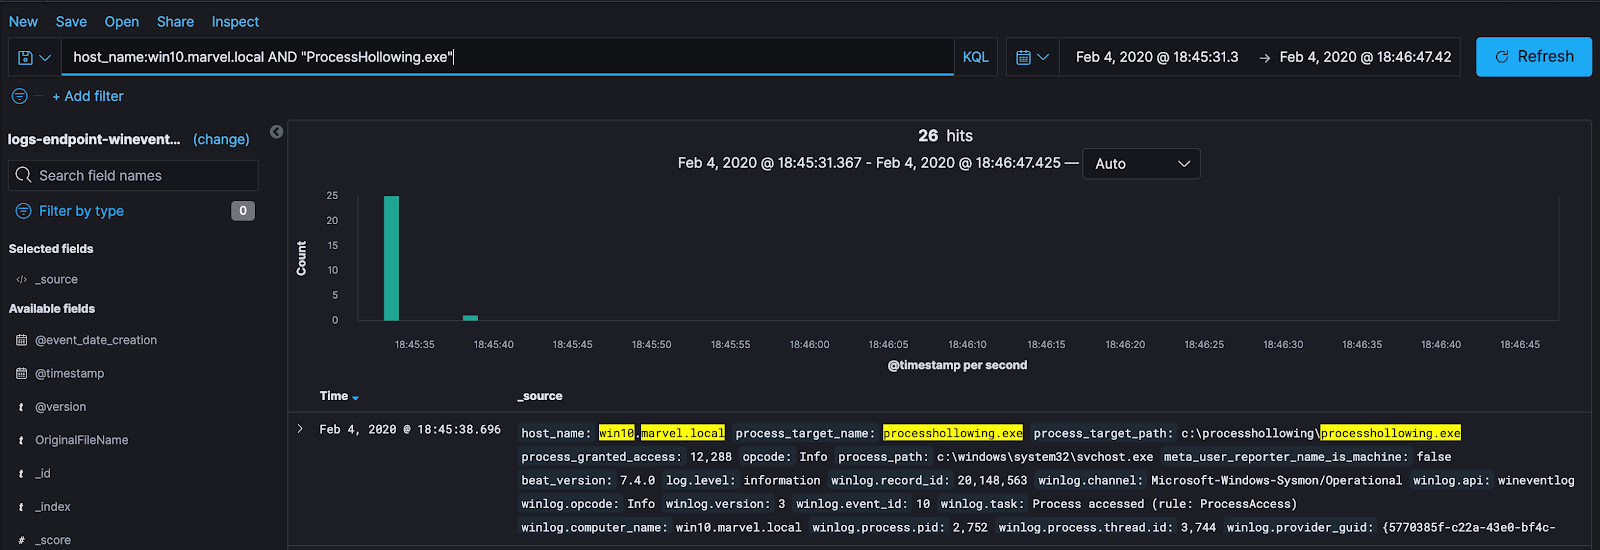
- **Process-based **— search for the POC or the process I know were affected by the attack just performed:
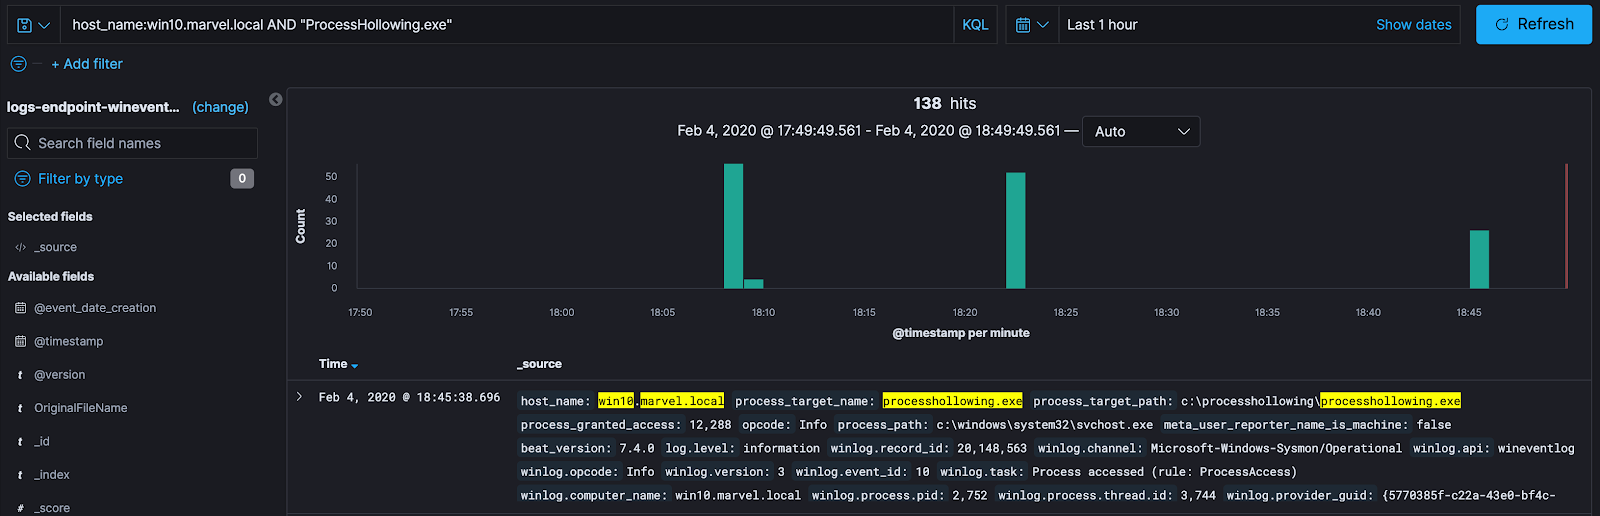
Here I am searching solely on the POC that was performed with the attack. With this method, I am looking at any interactions my malicious process had with any other processes, network connections, pipe connections, etc. Searching solely based on the process isn’t a bad method to use to find the data that correlates with the test. However, there might be segments of the data that might have “dropped off” — meaning they have been excluded due to our search terms, or we could be pulling in extra data that does not correlate with our test. Indirectly generated data has a high chance of not being included when looking at precise indicators like process name. Both of the situations can result in a misunderstanding of the technique and data available to us. Pulling data solely based on process name is a very “direct” analysis method. Meaning you are going to pull data that directly correlates with this event and/or process. This doesn’t account for any indirect behaviours that could have happened.
- **Time-based **— Search for the time for which the malicious activity as executed:
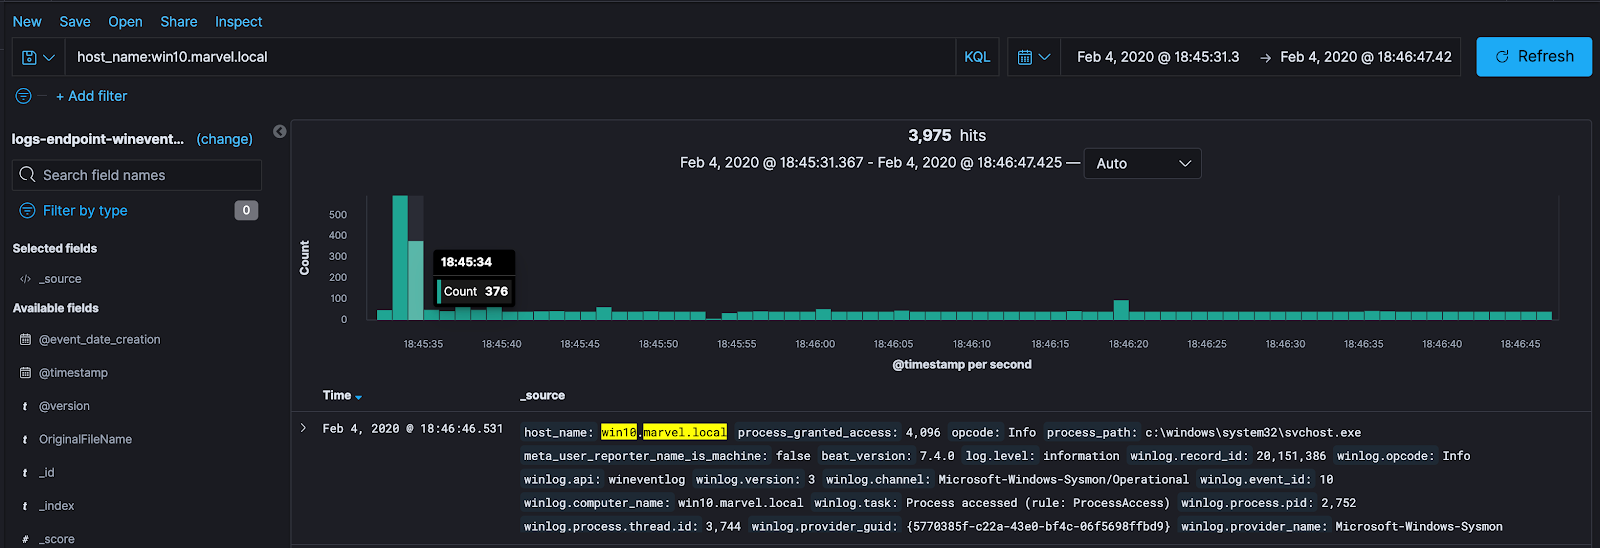
Time-based analysis can be nice because it will pull all data that correlates with our malicious act, whether it is direct or indirect. A downside to using this method is that there will be a lot more data to dig through to find the relationships to the malicious activity. So how can we pull direct and indirect behavior?
- **Process and time based **— combining the two methods:
This is my favorite method of searching for potentially useful data. It allows me to narrow down the events that correlate with the malicious act to perform proper modeling and analytics, no matter how long it might take me to do so. What I will typically do is perform this method of analysis to see what interactions my malicious activity had. This means — I want to see what processes communicated with my malicious process, what DLL’s were loaded, why were these DLL’s loaded, what registry keys were interacted with, etc.
After doing that analysis I can take away the malicious process and do a time-based search on those other processes or events that were directly affected by my malicious process, to see if some type of activity happened as a result of my test that I wasn’t aware would happen.
A good example of this would be, when I ran my test above, I started svchost.exe in a suspended state. It would be beneficial at any data surrounding the svchost.exe process that was created to see if it had any interactions with other processes. What actions did svchost.exe perform? Did svchost.exe load any DLL’s or perform any other behavior that might be of interest to me? Along with that, I can tie together the different types of events and attributes efficiently to understand the attack from a data perspective, without worrying about missing data that my search may have not pulled. This method ultimately eliminates that problem.
Data Modeling:
When going through this process it is good to know and understand the data sensor we want to utilize, along with remembering our research that we have previously conducted in the first part of this blog series: Research. When it comes to understanding our data sensor, this means understanding the following:
What type of data does this sensor fire?
- Network-based?
- Host-based?
- Process-based?
- Can I see authentication events?
How is this data being fired?
- Are they being pulled from ETW events?
- Are they hooking on a specific API and then firing?
What are some ways adversaries can bypass this data sensor?
Once we understand and have answered these questions about the data sensor we want to use and combine that knowledge with the knowledge we acquired while doing our research, we can start to make proper relationships within the data. This allows us to know what the data not only means when we are looking at it but also understand why this data is being propagated as a result of the malicious act being performed.
**Note: **For this blog and attack we will be using Sysmon as our data sensor. A lot of the questions that were asked above about this data sensor can be found within this a previous blog I wrote: Uncovering The Unknowns and this Github project.
Again, remember that this exercise is NOT the analytic logic piece. The goal for this piece is to extract attributes within the data that can be used to either join together or expose to bring out the behaviour of the malicious activity so that when we get to the analytics portion we can bring out these relationships to create an analytic. Similar to isolating malicious tests and events, the process by which this is typically done is subject to change based on the detection engineers preference. However, I have found a couple of things helpful:
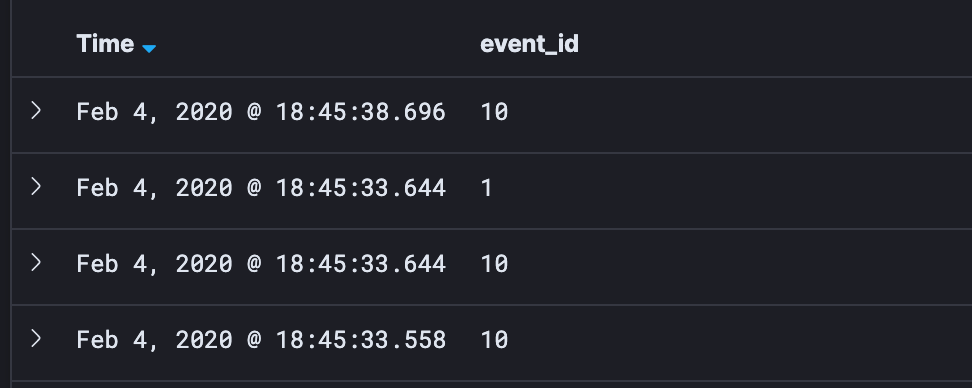
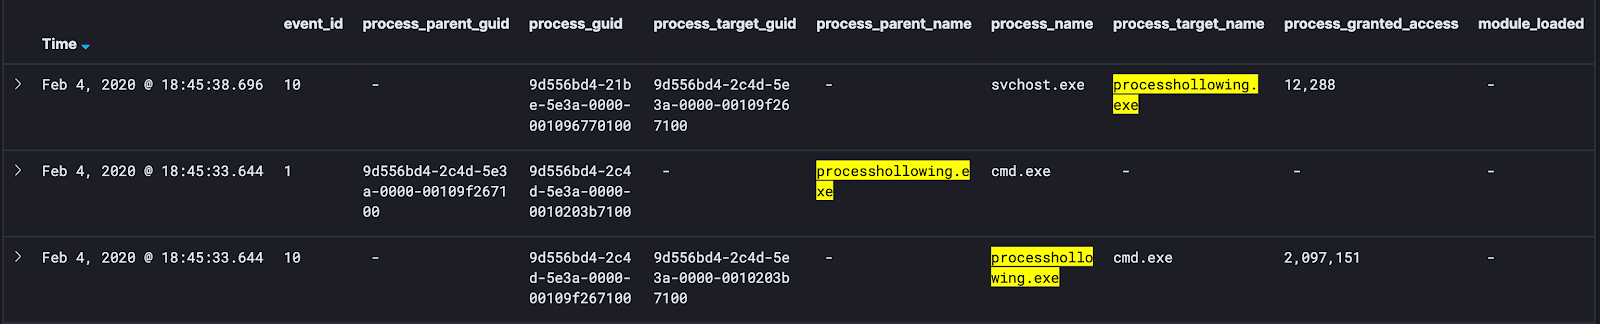
- Show the Event ID of each data event:
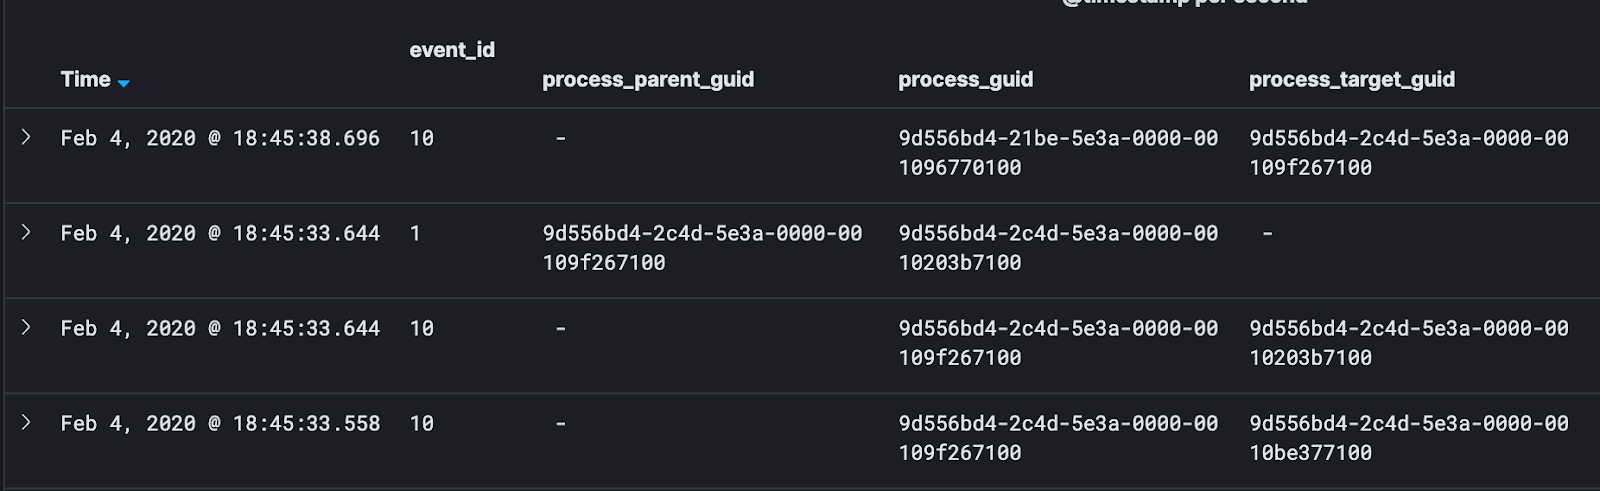
- I want to pull out things that will help me link these events together. To do this, I pull out the primary keys. These are globally unique identifiers. I.e — Process GUIDs. I like to look at Parent Process GUIDs, Process GUIDs, and Target Process GUIDs:
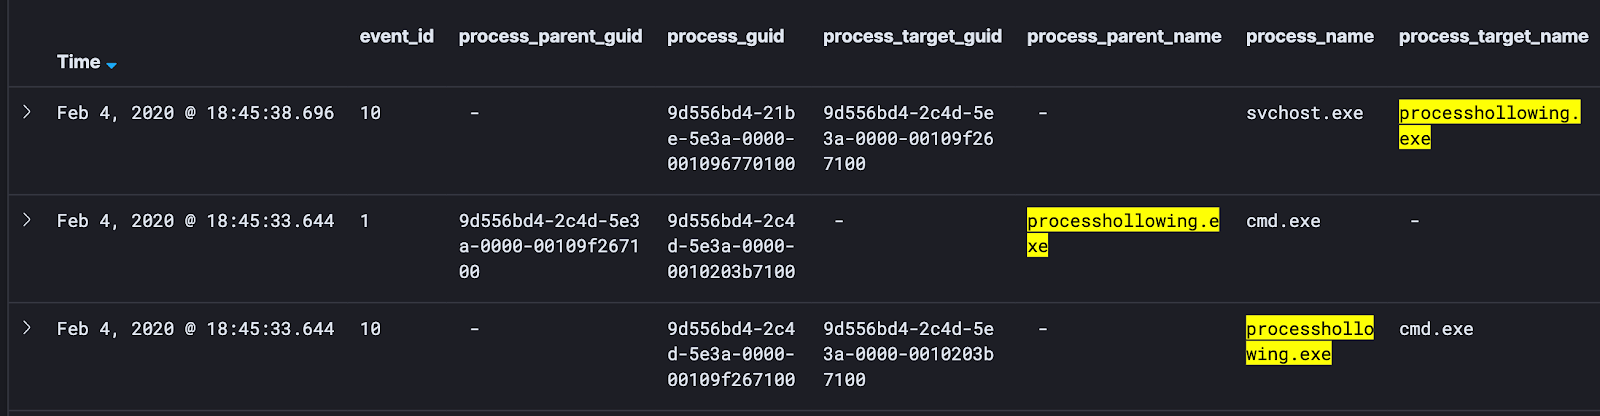
- Next, I will pull out things like process names, process target names, and process parent names:
- Lastly, I will pull out attributes like Granted Access, Module Loaded, and other attributes to help me get a grasp on how this data is working together:
Any attribute that I can pull out and expose within the data will give me a better understanding of how this attack works and how I can build the analytic logic for the detection.
Now that the attributes of the data have been filtered out of the events, I can start to do a quick analysis of the data. This is meant to help me understand how this data was created, why the attributes within the data are the way they are, and how I could massage this data to perform advanced analytics. Why are certain DLL’s being loaded? Is there indirect data I can pivot on for my detection? This would be ideal because these are things the attacker does not have control over.
Once this data is in a format that we can do a quick analysis, I can also start to think about — where on the detection spectrum do I want my detection(s) to be? Remember — I can have multiple detections per attack technique. That being said, it is okay to split up my detections to fit at different points of the spectrum and to cover different levels of the abstraction layers that we have previously uncovered. It is important to keep this in mind while I start to create my data model before I move into the data analytics piece.
Conclusion:
Throughout this blog, I really wanted to walk through the process by which I personally go about performing tests of malicious activity and my approach to the data modeling and relationship process. This might seem to be a simple and easy task, however, from my experience this step is often not given the attention it requires. Not to say there aren’t other ways to get the same result, some might be more efficient.
However, I wanted to show this process as it enables us as detection engineers to take a moment and look at the data that is fired from a test. When we look at this data, what do you typically see? When we look at this data, the goal is to be able to pull out the important attributes as they will give us the secrets of the behaviour of the malicious activity that was performed. Once we can see this behavior and see the relationships, we can start to form our detection strategy. When we do this we have to ask ourselves — “What part of the data are we wanting to pivot on? What part of the malicious activities are we going to focus on?” This could be a hash of the malicious file, it could be the processes by which the malicious file is affecting or spawning, or when a specific API call is called. Part of this strategy phase is asking ourselves, where on the detection spectrum would we like for this to fall on.
Within Part 3 of this series David Polojac will walk through the different detections strategies we can take, how they fit on the detection spectrum, then how to turn those detections into analytic logic so that we can use them as alerts within our environment. Hope you enjoyed this walkthrough!
Resources:
- Capability Abstraction by Jared Atkinson
- Detection Spectrum by Jared Atkinson and Richie Cyrus
- Huge thank you to Josh Prager (Bouj33 Boy) and David Polojac for helping with this project.
- Dwight Hohnstein’s POC on Process Hollowing.
- Mitre ATT&CK: Process Hollowing