EtwWatcher
A research passion of mine is telemetry. This could be the identification of new telemetry sources, how to tap into telemetry sources to feed prevention and detection, or how to leverage that telemetry in ways others aren’t to surface adversarial tradecraft. Whichever one of these I am doing, I constantly find myself needing to query ETW providers.
To get this information I find myself following this process:
- Install ETWInspector locally or on a VM.
- Pull ETW Providers.
- Query a specific provider’s metadata
In the cases I am trying to find newer versions of a provider, I have notes of interesting ones I have kept track of for a couple of years, Microsoft-Windows-Threat-Intelligence for example, and I check against older versions of the provider to see what has been changed or what is new.
This process, although not terrible, can become exhausting as time goes on. It doesn’t scale well, especially in situations where I don’t know about a provider and I want to track updates across builds. Being able to do so might lead to newer detection opportunities for tradecraft or for understanding a newer Windows feature.
Whether you’re like me or a defensive/offensive engineer, people have to follow a similar process to find what’s new or what might be useful for a piece of tradecraft.
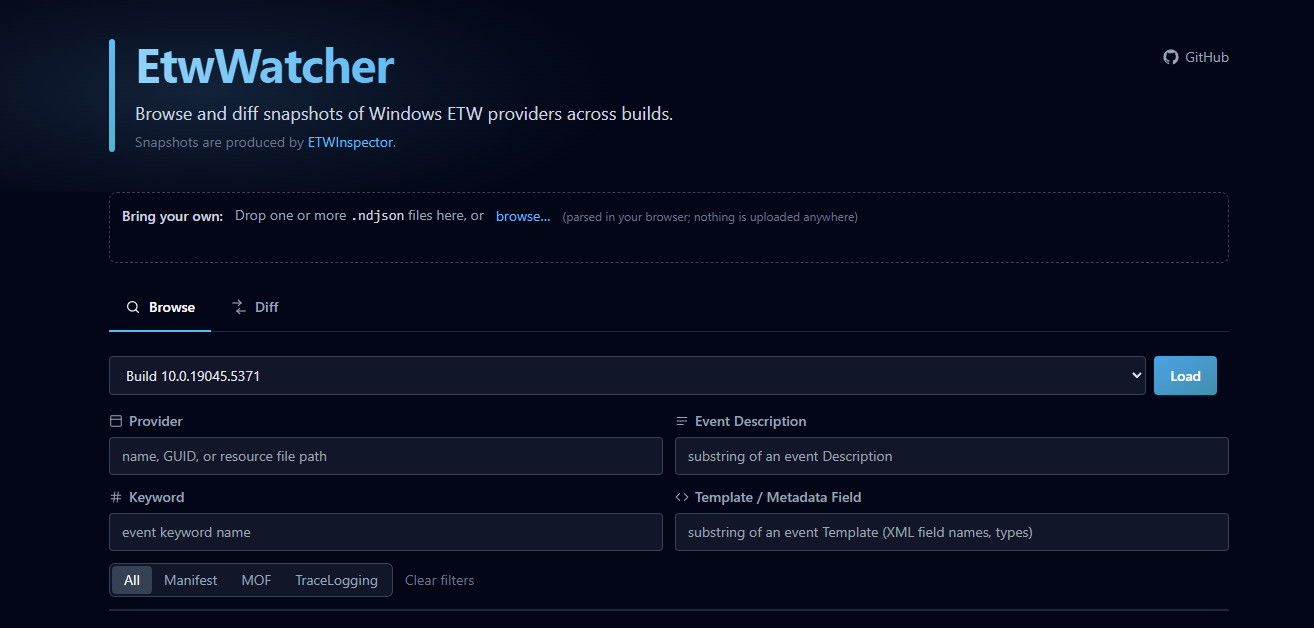
So, I built EtwWatcher.
- Live site: https://jonny-jhnson.github.io/EtwWatcher/
- GitHub Repo: https://github.com/jonny-jhnson/EtwWatcher
EtwWatcher is a static site that takes ETW provider snapshots captured via ETWInspector from real Windows builds, commits them to a repo as NDJSON, and renders the whole thing client-side.
There’s no longer a need to install anything — unless you’re on a build that isn’t on the site yet, in which case you can pull a snapshot manually and upload it, or contribute it via pull request. You don’t stand up a VM. You open the page, pick a build, and start looking.
If you want a diff, you pick two builds and you get one — providers added, providers removed, providers whose events shifted, with line-by-line highlighting on event descriptions and template XML.
Walkthrough
Navigating EtwWatcher is super easy. There are two main views -Browse and Diff - plus an upload section. Let’s walk through each one!
Browse
Pick an ETW snapshot from a build of your choosing and start querying it. Filter providers by name/GUID/resource path, by event description, by keyword name, or by template XML field. Toggle All / Manifest / MOF / TraceLogging to scope by schema source. Click a provider to see its events, levels, opcodes, keywords, full template XML, and (for TraceLogging) the list of binaries it was discovered in. This is incredibly useful if you don’t have access to a VM or don’t want to pull all the tools down to query ETW providers.
For example, let’s say you are curious about any DNS-based providers available on OS Build 10.0.26200.7171. You could type “DNS” into the Provider filter. Three providers will resolve:
Microsoft-Windows-DNS-Client(Manifest)Microsoft-Windows-ZTDNS(Manifest)Microsoft.Windows.Networking.DNS(TraceLogging)
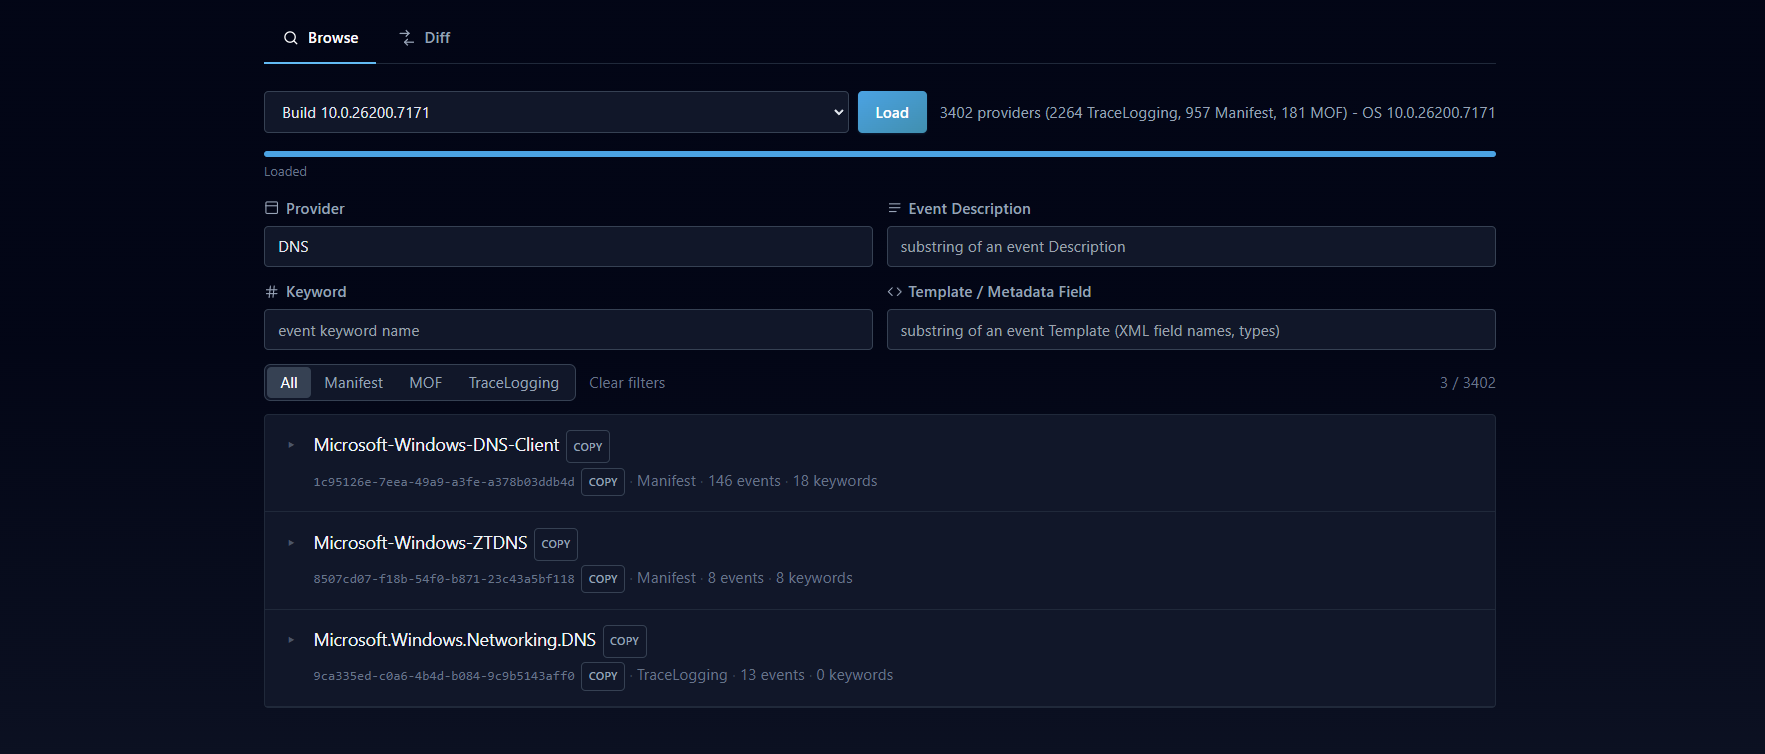
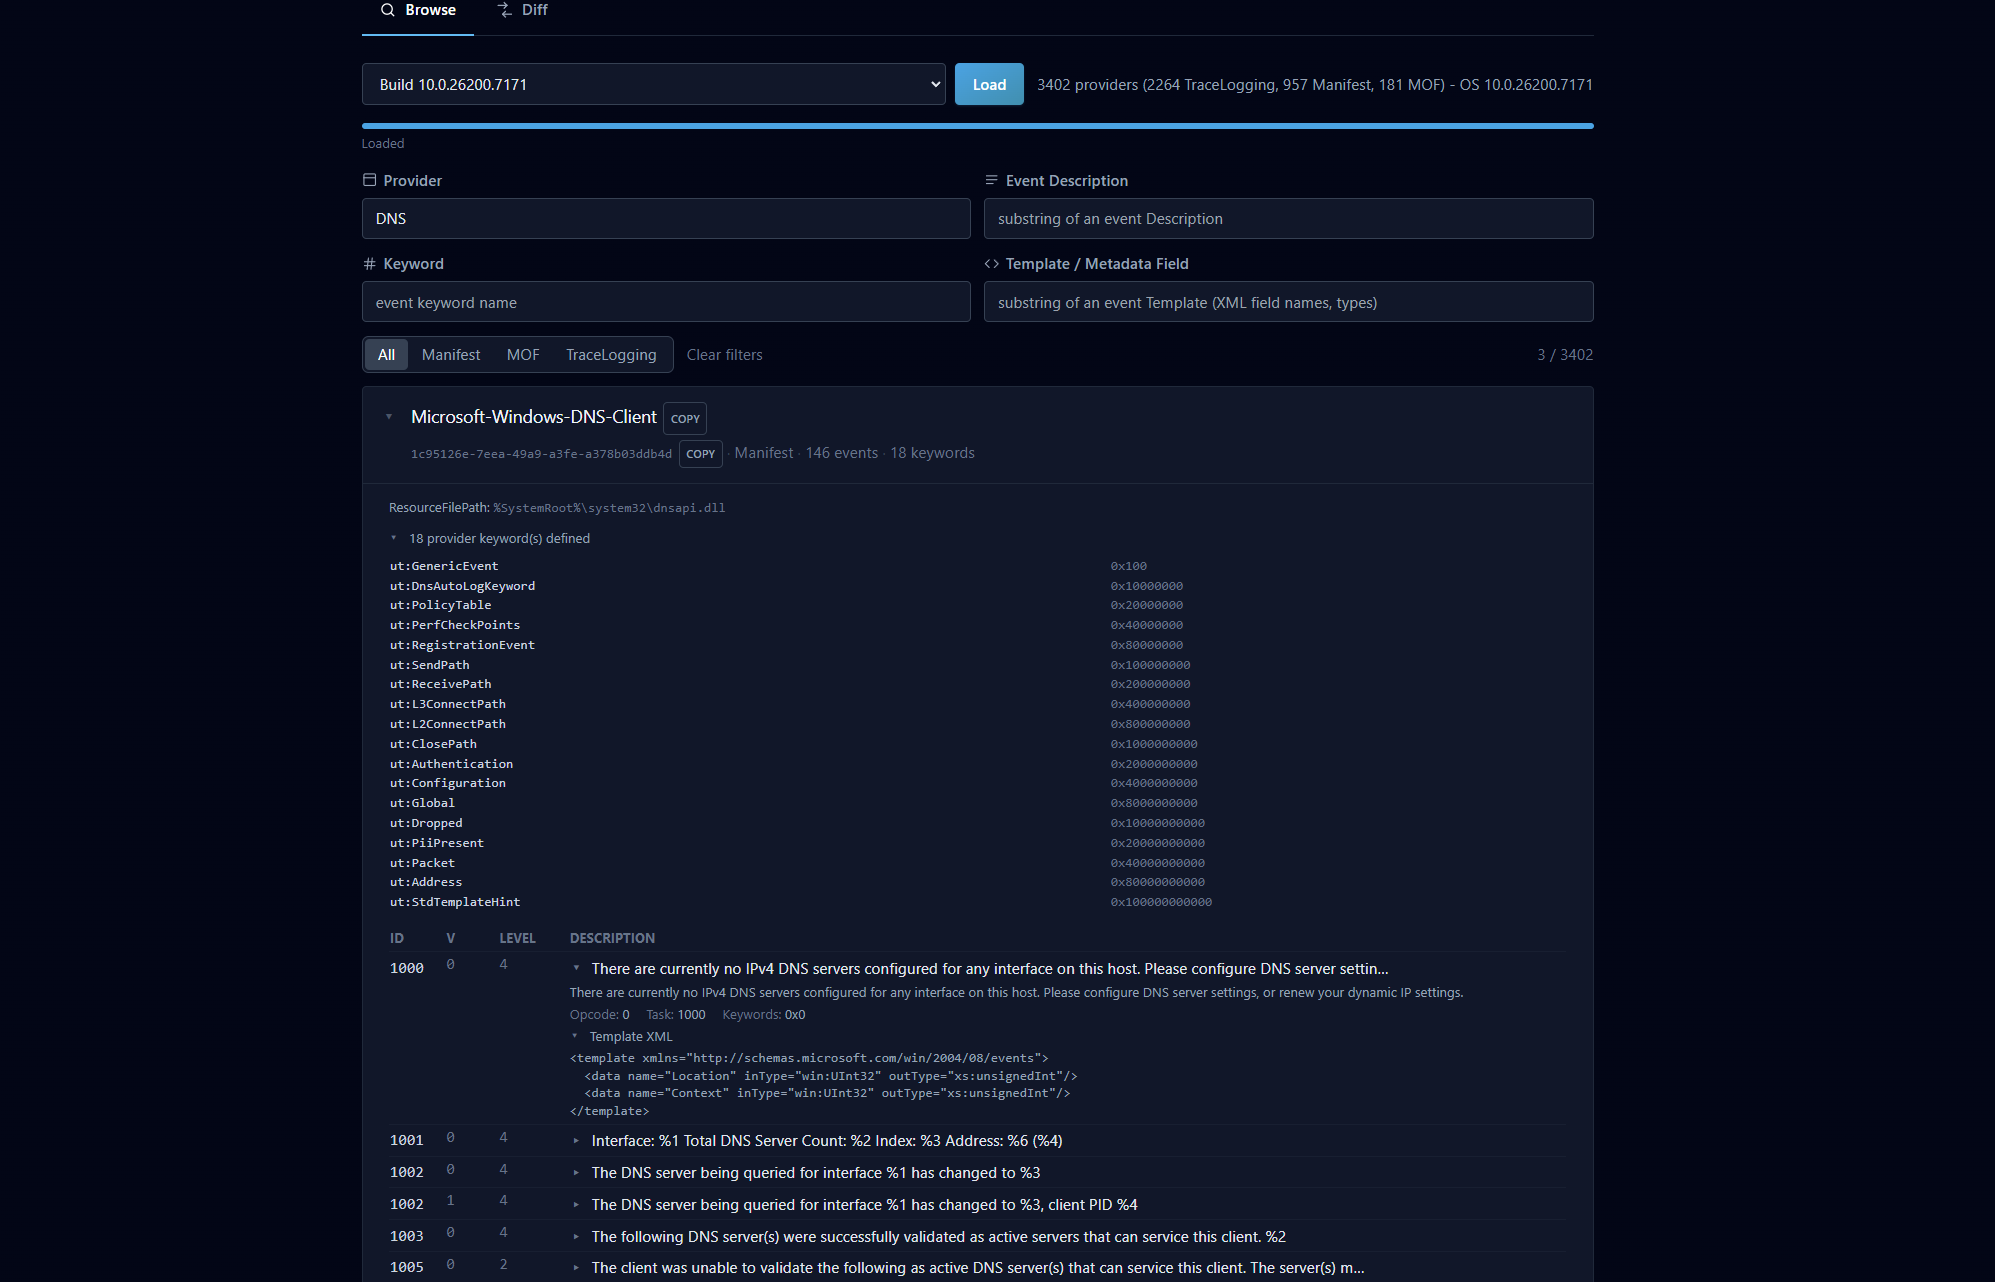
We can open up the view for Microsoft-Windows-DNS-Client and see the ResourcePath, Keywords, and Events:
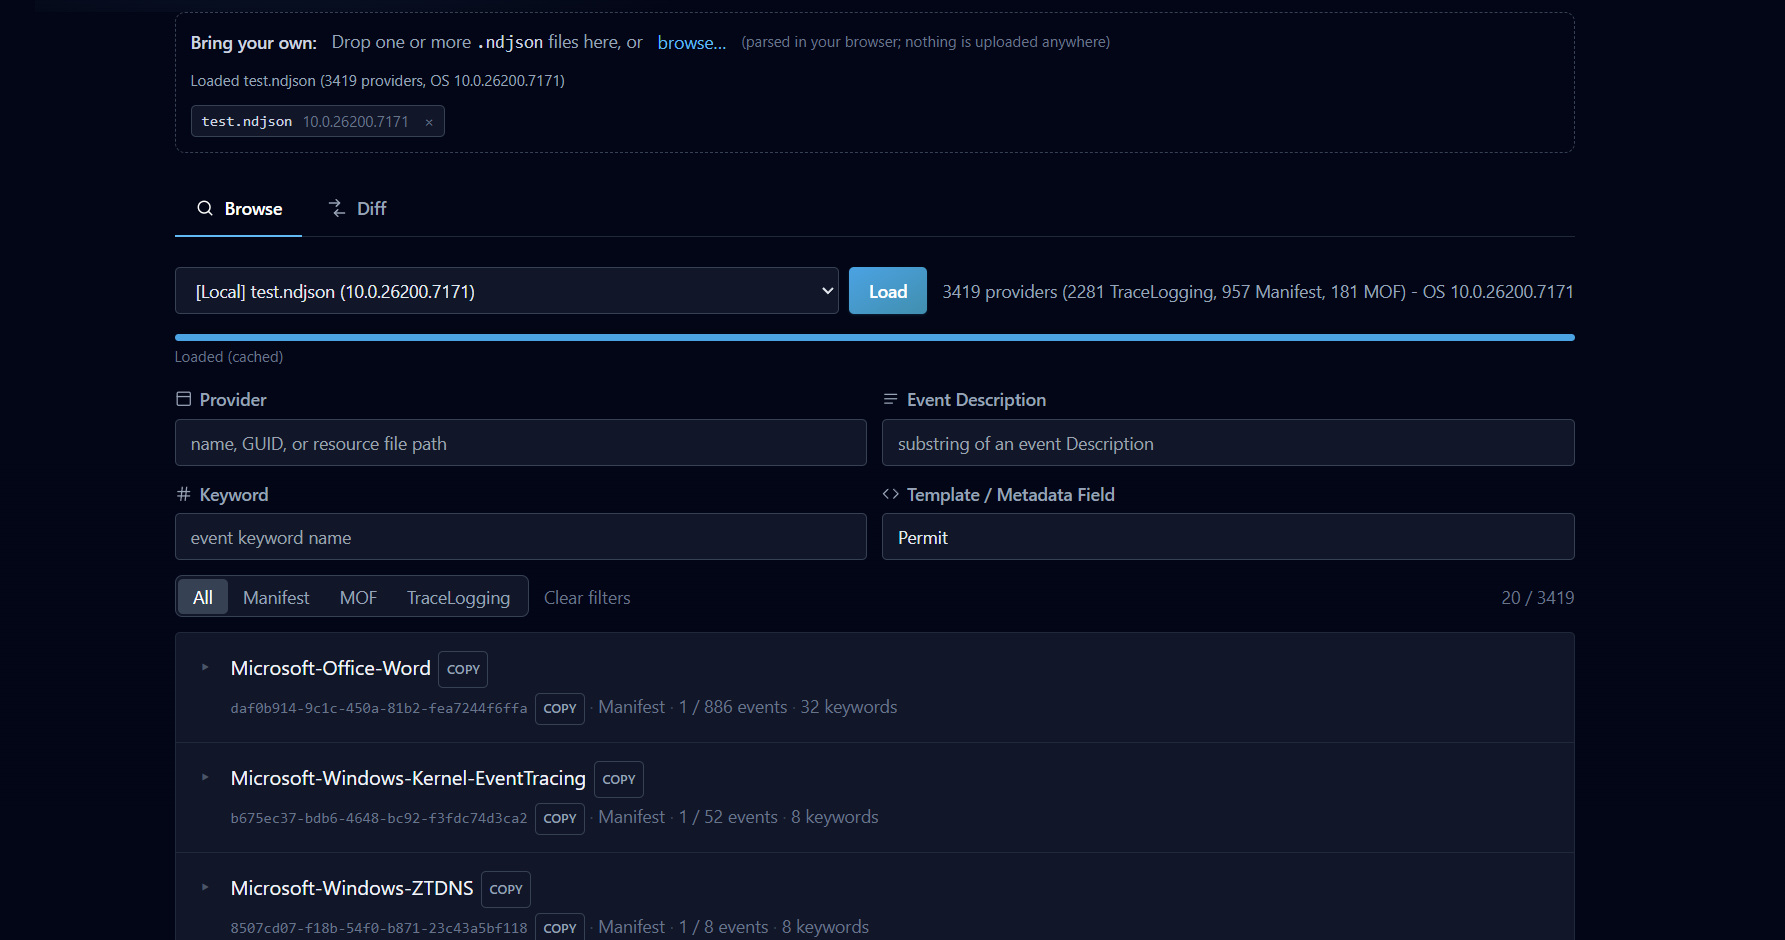
Let’s say we want to see any DNS-based events that have “Permit” in them. We can go to either Event Description or Template / Metadata Feildand add “Permit”. This returns Event ID 1 under the Microsoft-Windows-ZTDNS provider:
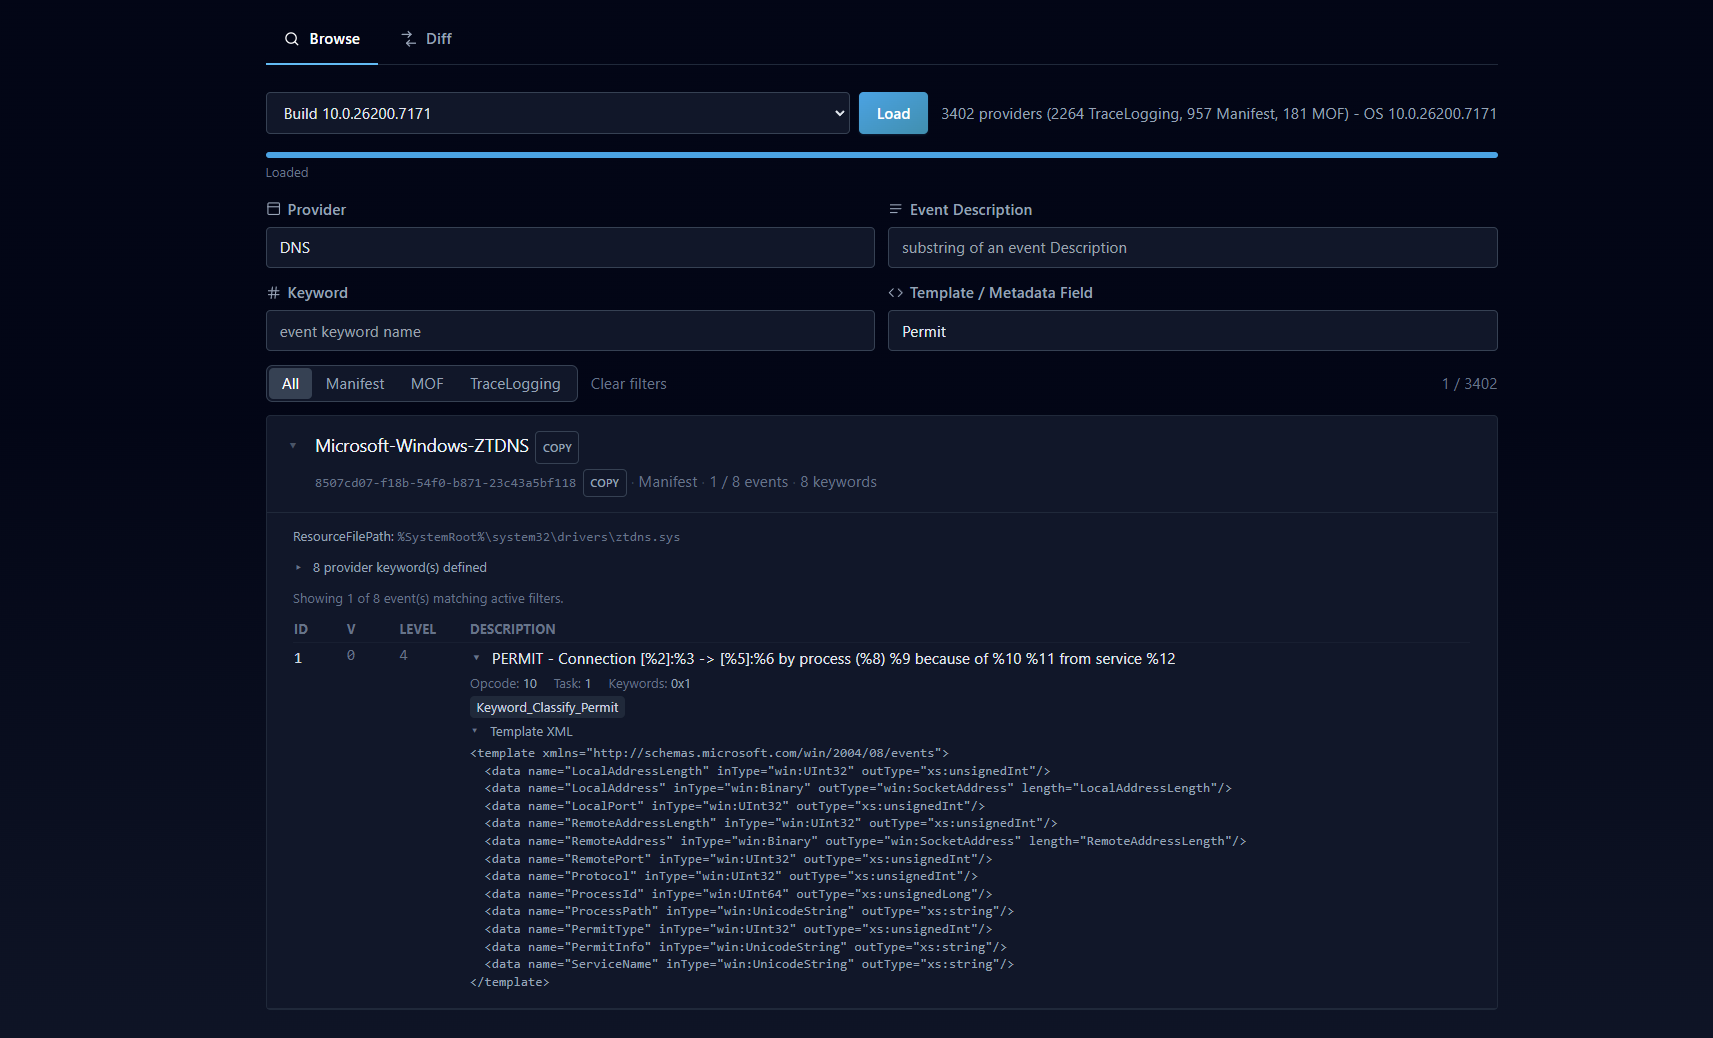
This is something I wish I had for years. I don’t want to download/open a tool on disk every time I want a quick answer about a provider.
Diff
Compare two ETW snapshots across builds. The page returns providers added, providers removed, and providers changed - and for each changed provider, every event whose metadata differs, with A and B values side by side. The same four filters apply, so you can scope a comparison to “TraceLogging providers only, with Process in the name” if that’s the question you actually have.
For example, let’s look at the updates between OS Build 10.0.19045.5371 and OS Build 10.0.28020.1921 for the Microsoft-Windows-Threat-Intelligence ETW provider:
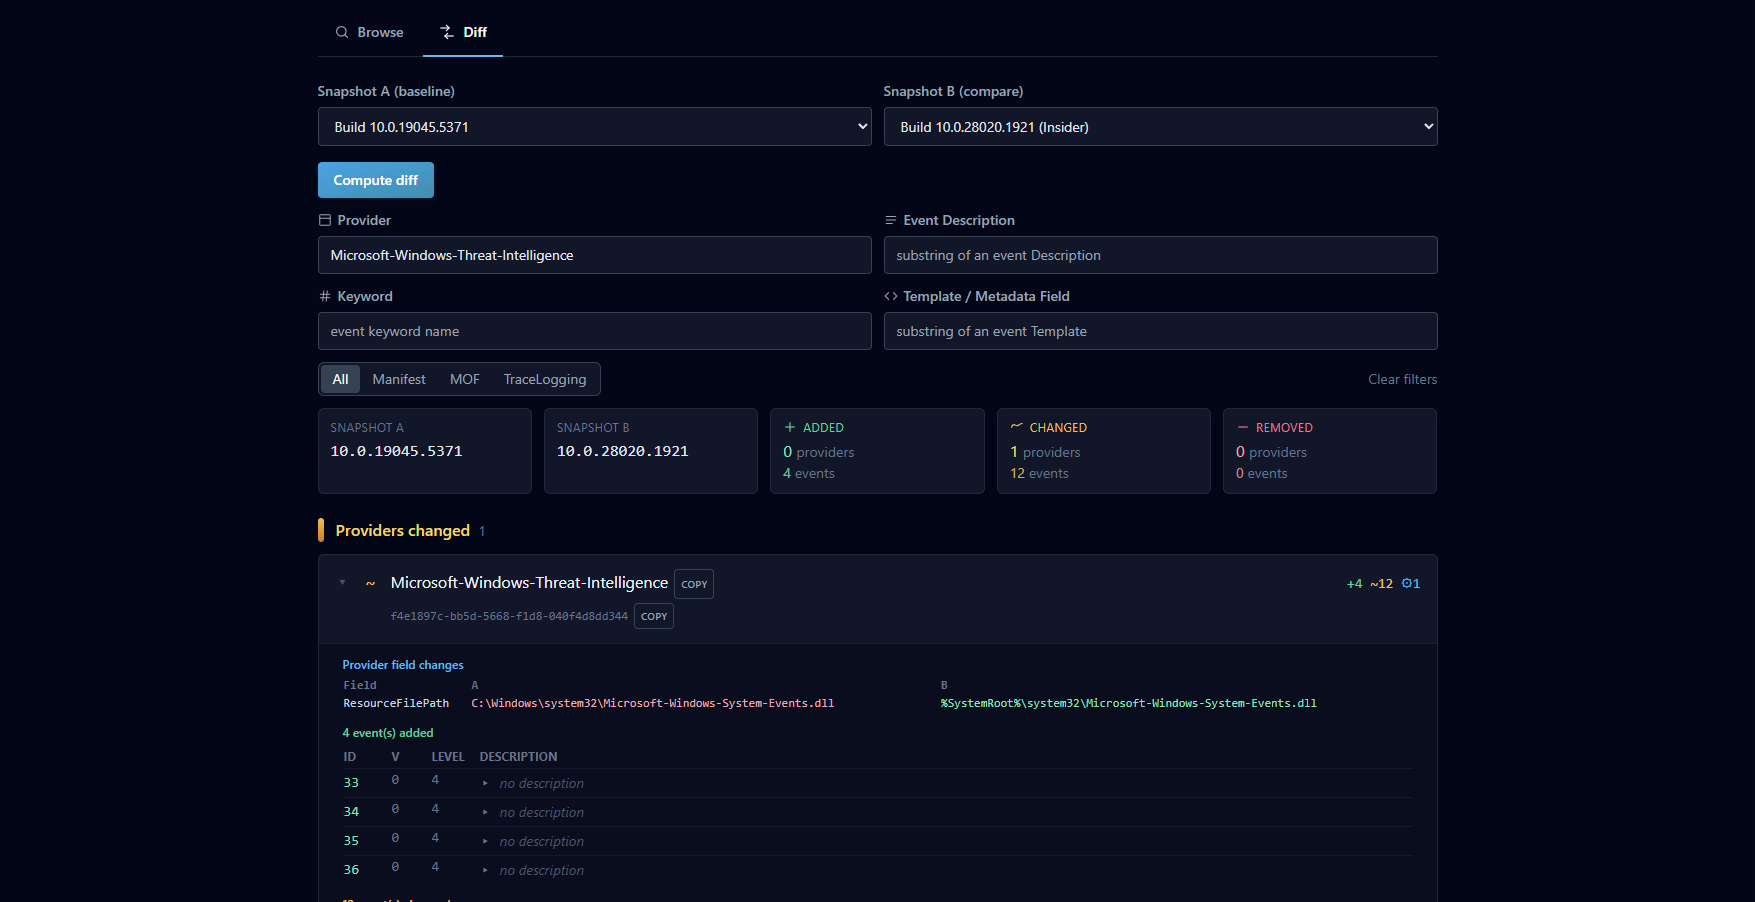
You can see a lot of events changed and some were added. You might be wondering though - didn’t OS build 10.0.19045.5371 already have some of these events? You’d be correct. However, ETW events can ship new “versions” as their schema evolves, and that’s what you’re seeing here. An example is Event ID 2. Version 1’s template XML looks like:
<template xmlns="http://schemas.microsoft.com/win/2004/08/events">
  <data name="CallingProcessId" inType="win:UInt32" outType="win:PID"/>
  <data name="CallingProcessCreateTime" inType="win:FILETIME" outType="xs:dateTime"/>
  <data name="CallingProcessStartKey" inType="win:UInt64" outType="xs:unsignedLong"/>
  <data name="CallingProcessSignatureLevel" inType="win:UInt8" outType="xs:unsignedByte"/>
  <data name="CallingProcessSectionSignatureLevel" inType="win:UInt8" outType="xs:unsignedByte"/>
  <data name="CallingProcessProtection" inType="win:UInt8" outType="xs:unsignedByte"/>
  <data name="CallingThreadId" inType="win:UInt32" outType="win:TID"/>
  <data name="CallingThreadCreateTime" inType="win:FILETIME" outType="xs:dateTime"/>
  <data name="TargetProcessId" inType="win:UInt32" outType="win:PID"/>
  <data name="TargetProcessCreateTime" inType="win:FILETIME" outType="xs:dateTime"/>
  <data name="TargetProcessStartKey" inType="win:UInt64" outType="xs:unsignedLong"/>
  <data name="TargetProcessSignatureLevel" inType="win:UInt8" outType="xs:unsignedByte"/>
  <data name="TargetProcessSectionSignatureLevel" inType="win:UInt8" outType="xs:unsignedByte"/>
  <data name="TargetProcessProtection" inType="win:UInt8" outType="xs:unsignedByte"/>
  <data name="OriginalProcessId" inType="win:UInt32" outType="win:PID"/>
  <data name="OriginalProcessCreateTime" inType="win:FILETIME" outType="xs:dateTime"/>
  <data name="OriginalProcessStartKey" inType="win:UInt64" outType="xs:unsignedLong"/>
  <data name="OriginalProcessSignatureLevel" inType="win:UInt8" outType="xs:unsignedByte"/>
  <data name="OriginalProcessSectionSignatureLevel" inType="win:UInt8" outType="xs:unsignedByte"/>
  <data name="OriginalProcessProtection" inType="win:UInt8" outType="xs:unsignedByte"/>
  <data name="BaseAddress" inType="win:Pointer" outType="win:HexInt64"/>
  <data name="RegionSize" inType="win:Pointer" outType="win:HexInt64"/>
  <data name="ProtectionMask" inType="win:UInt32" outType="xs:unsignedInt"/>
  <data name="LastProtectionMask" inType="win:UInt32" outType="xs:unsignedInt"/>
</template>
Version 2 keeps the same 24 fields and appends seven more:
<data name="VaVadQueryResult" inType="win:UInt32" outType="win:NTStatus"/>
  <data name="VaVadAllocationBase" inType="win:Pointer" outType="win:HexInt64"/>
  <data name="VaVadAllocationProtect" inType="win:UInt32" outType="xs:unsignedInt"/>
  <data name="VaVadRegionType" inType="win:UInt32" outType="xs:unsignedInt"/>
  <data name="VaVadRegionSize" inType="win:Pointer" outType="win:HexInt64"/>
  <data name="VaVadCommitSize" inType="win:Pointer" outType="win:HexInt64"/>
  <data name="VaVadMmfName" inType="win:UnicodeString" outType="xs:string"/>
You don’t actually have to do this comparison by hand. The Diff view pairs Id 2’s new v2 against v1 automatically, labels the row Id 2 v1 -> v2 [NEW VERSION] under “events changed”, and highlights the seven added <data> lines in green inside the template panel. The manual templates above are shown for clarity in this post - in the tool itself, surfacing the same delta is one expand-click away.
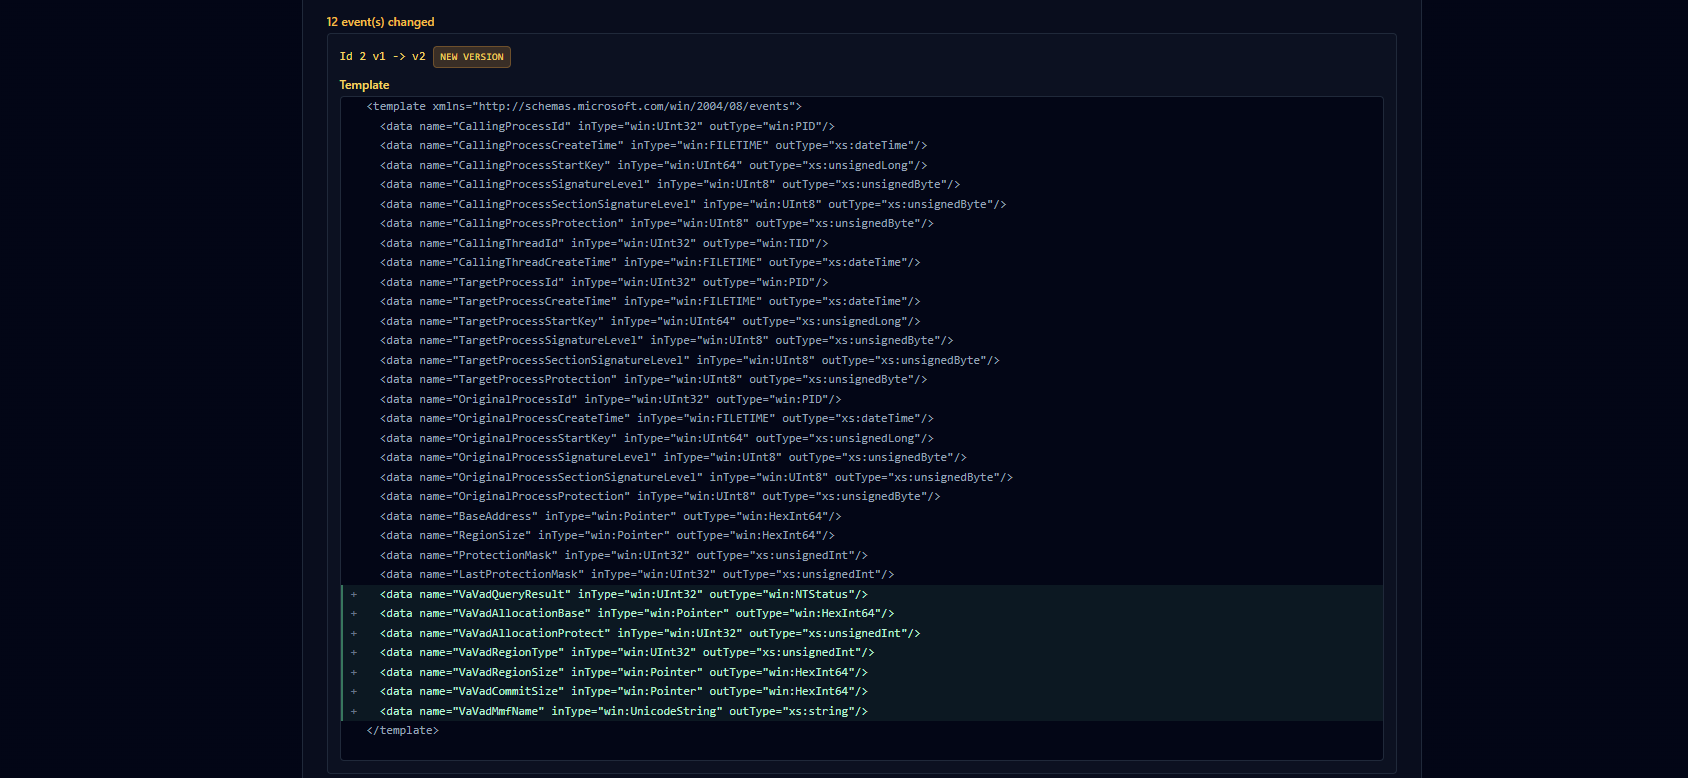
This is super valuable, especially for folks at sensor companies who want to add the newest fields to their telemetry surface.
This isn’t the only benefit. Researchers tracking newer events tied to vulnerabilities or adversary tradecraft can use this to watch how those events evolve over time. It’s already been useful for me in finding newer events, which led to another research project and a follow-up blog on what I found.
Bring your own snapshot
There’s a drop zone at the top of the page. Plain .ndjson straight from Export-EtwSnapshot works; gzipped .ndjson.gz works too (decompressed in the browser). The file never leaves your tab - parsing is entirely client-side. This matters if you’re working with a build that hasn’t been committed to the repo yet, or one you can’t share publicly. You can still do all of the browsing and diff’ing that was shown above with your local upload against the other snapshots:
I also wanted to make this easy to share with other researchers, so one handy feature is that everything is URL-encoded. This makes sharing findings with others or in blogs easier. The active tab, the picked snapshots, and every filter live in the URL fragment, so when you land on something interesting, copy the link and the person on the other end sees the same view.
What it doesn’t do (yet)
When enumerating ETW providers you’ll notice that Manifest, MOF, and TraceLogging providers are all covered. However, MOF and TraceLogging have known gaps. Both come down to how those providers are stored under the hood, not how ETWInspector queries them. Here are the specifics:
MOF events don’t currently populate.
MOF providers are considered registered providers, so they are listed. However, their events aren’t. Querying MOF provider events is cumbersome and something I haven’t figured out how to do reliably. Manifest and TraceLogging events carry full metadata. I’m exploring better approaches to MOF event enumeration and hope to have an update soon. Don’t let this deter you from MOF providers though - there are a lot of interesting ones out there, you just have to find the ones you care about and query them manually for now.
TraceLogging events aren’t bound to a specific provider.
Unlike Manifest providers, TraceLogging metadata isn’t registered with the OS - it’s compiled into the binary itself, stored in a _TraceLoggingMetadata_t structure that begins with the four-byte signature ETW0 (Matt Graeber’s post goes over this format really well). That structure carries an array of provider metadata and an array of event metadata, but no per-event provider ID. When a binary declares multiple TraceLogging providers, each one ends up listed against the binary’s full event set. Recovering the actual per-event binding requires static analysis - walking TraceLoggingWrite calls in IDA or a similar disassembler and resolving which provider handle each call site passes.
I understand these gaps aren’t ideal, but I think it’s still valuable to have this data exposed when trying to enumerate what is available.
Contributing
The data comes from ETWInspector, the PowerShell module I maintain for ETW enumeration. Snapshots are produced by Export-EtwSnapshot and committed to the repo. Nothing is synthesized, scraped, or inferred:
Install-Module EtwInspector
Import-Module EtwInspector
Export-EtwSnapshot C:\Snapshots\10_0_26200_7462.ndjson
If you want to submit a pull request you will need to run scripts/update-manifest.ps1 so the snapshot gets compressed properly. You don’t need to worry about removing the raw .ndjson - the script removes it for you, and it’s gitignored anyway. This step is required because uncompressed snapshots routinely exceed GitHub’s per-file size limit, mostly due to TraceLogging providers.
What’s next
Snapshots will be added on an ongoing basis. The cadence I’m aiming for:
- Patch Tuesday cumulative updates for currently supported Windows builds, so you can see what shifted between e.g.
26200.7462and whatever ships next. - Insider / Canary builds as Microsoft pushes them, for early signal on what providers and events are being added or restructured before they hit GA.
If you want a specific build snapshotted, open an issue with the build number. Or grab ETWInspector and contribute the compressed NDJSON directly — the “Adding a snapshot” section in the repo README walks through it.
Conclusion
I hope others find this new tool useful for their research/ETW discovery. If you find yourself using it a lot, I’d like to hear what for. Of course — if you find any issues with the project, please do not hesitate to reach out or submit a Issue on GitHub.
Links
- Live site: https://jonny-jhnson.github.io/EtwWatcher/
- EtwWatcher repo: https://github.com/jonny-jhnson/EtwWatcher
- ETWInspector repo: https://github.com/jonny-jhnson/ETWInspector
- ETWInspector on PowerShell Gallery: https://www.powershellgallery.com/packages/EtwInspector