Utilizing RPC Telemetry
A joint blog written by Jared Atkinson, Luke Paine, and Jonathan Johnson
Introduction
A few months ago, Jared Atkinson released a blog post that introduced a detection engineering methodology he referred to as Capability Abstraction. Since then, our team at SpecterOps has been working to implement this approach across a diverse set of attack techniques to learn the strengths and weaknesses of it as a whole. What we’ve learned thus far is that capability abstraction provides analysts with a set of proverbial legos they can use to answer more complex questions that they may not have been aware of initially. Through documentation and research, the understanding of these concepts can be reapplied in situations that they were not initially intended for. This post focuses on one such example where our team had built an abstraction for a technique that ultimately resulted in the ability to easily solve what otherwise seemed to be a very difficult problem. On June 26th, Matt Graeber offered to throw money at anyone who could extract the relationship between COM/RPC client and server interactions. The conversation is shown below for full clarity for the reader.
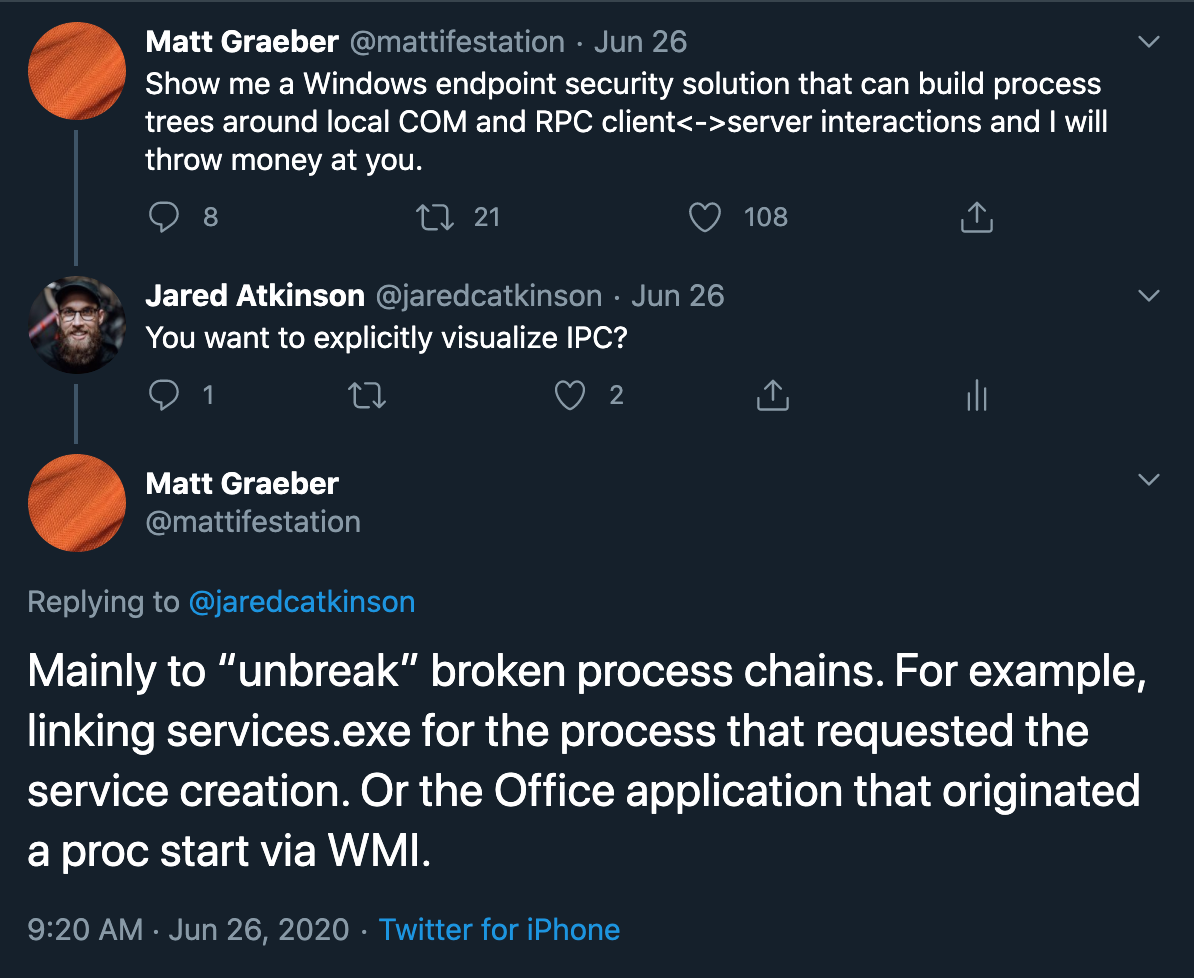
This conversation was particularly interesting to us because we’d recently conducted research that had inadvertently answered one of the exact use cases Matt described. Solving this problem in a generic way may be an extremely difficult problem (and maybe why Matt would throw money at whoever could do this), but we think it is worthwhile to explore one example of the problem set, specifically “linking services.exe to the process that requested the service creation”. This post will explore service creation and how an analyst or application can use commonly available telemetry to correlate service creation to the process that requested the action.
To solve the service creation problem, it is important to consider the following questions:
- How can an analyst identify every time (to the best of their ability) a service is created?
- How can an analyst correlate that service creation event with the client that requested it?
Capability Abstraction
At SpecterOps, we use a detection engineering technique called Capability Abstraction. One of the goals of Capability Abstraction is to understand how an attack technique functions “under the hood” to allow for more accurate detection coverage. The reason Matt’s service creation example was so interesting is that Luke Paine happened to be working on the New Service technique abstraction (specifically focused on service creation) simultaneously.. Before we get too deep into correlating events, let’s discuss service creation and some of the important concepts involved within.
Service Creation
Service creation is a technique that is used by adversaries to create a service on a host. This can be used for privilege escalation, lateral movement, or persistence. One native way an attacker can do this is through “sc.exe”. Using “sc.exe” is as easy to leverage as the example below:

A common method for identifying a new service creation is by using both Event ID 7045 and 4697. While similar, these two event IDs have some differences:
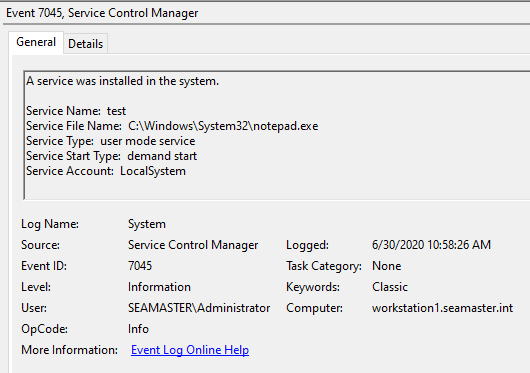
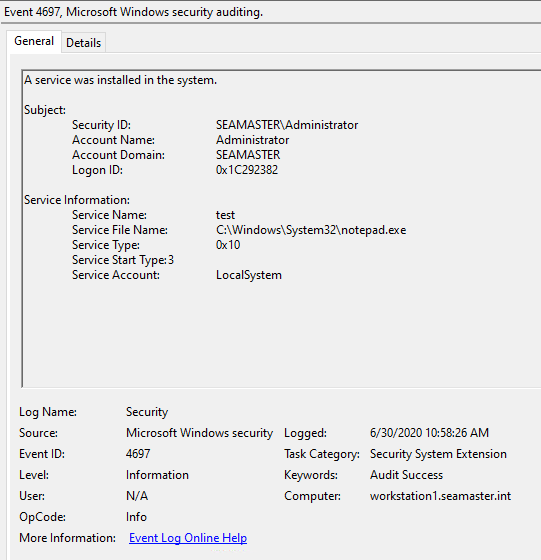
In these screenshots, we see that 4697 provides us with the account name that requested the installation, and a Logon ID to aid with correlation to other events, which can help determine a remote service installation over a local one. Other than that, the information they provide are quite similar.
In order to understand other telemetry sources that can be used, we need to understand the Service Control Manager (SCM) and its relationship with the registry. The Service Control Manager is a persistent process that starts when a system is booted and serves as the middleman between other processes and Windows services. It transmits requests to start and stop services and handles the installation of new services or removal of old ones. While running, the SCM maintains a current list of installed services in memory. A backup of this database is maintained in the registry at HKLM\SYSTEM\CurrentControlSet\Services. When a new service is installed, the SCM creates the relevant entry in the registry. When the system boots, this registry hive is enumerated and pulled into the memory of the SCM. You can also manually create a registry entry for a new service. During a system’s reboot, that service is loaded and recognized by the SCM. This introduces an issue with our tracking of remote service installation — if a remote registry change is made, and the system is rebooted — a 7045 or 4697 is not generated. This is because the logging capability for service creation is implemented in the creation functions of the SCM. If the SCM is not tasked with the creation, and instead the service is “side-loaded” into the database via the registry, the SCM will assume that it was there the entire time.
This leads us to the next possible method for tracking service creations, along with the answer to our first question.
Question 1: How can an analyst identify every time (to the best of their ability) a service is created?”
**Answer 1: **By monitoring the registry for the creation of new subkeys under HKLM\SYSTEM\CurrentControlSet\Services.
This approach can easily be implemented using both Windows SACLs and Sysmon’s Event ID 12, but it is a noisy approach. In addition, the SCM (services.exe) will be tasked with the service creation and will appear as the creator of the registry keys in your logging mechanism, as seen in the following screenshot.

While it may be fruitful to monitor for changes to this registry location by processes that are NOT the SCM — this takes us no further in our journey to reliably distinguish when a service creation is occurring. Based on that, we need to look at other technologies that service creation is leveraging which can give us context as to whether the service was created locally or remotely. This leads us to explore IPC mechanisms.
Inter-Process Communication
At this point we know that a registry key is created for every new service. We also know that when sc.exe is used to create a service, services.exe actually creates the requisite registry key. The problem that we want to solve is given a registry key that indicates service creation, how do we correlate events to identify that sc.exe is the client requesting the service be created? Over the past few months we’ve been working on building a more formal process around our Capability Abstraction methodology, and one of the recurring themes we’ve seen across numerous techniques, specifically on Windows, is the use of Inter-process Communication (IPC). Whenever you see a situation where “application A” (sc.exe) requests an action, and that action is performed by “application B” (services.exe) the usual culprit is IPC. One of the most common implementations of IPC is Remote Procedure Call (RPC), and while breaking down the abstraction of the new service technique, we noticed that RPC is tantamount to this relationship. Before we move too much further, it is probably a good idea to spend some time discussing RPC fundamentals so we have a better foundation for when we build our correlation
Remote Procedure Call
A Remote Procedure Call (RPC) is a technology used for distributed client/server communications between programs. This technology is one of the most common IPC mechanisms, allowing for applications and programs to send signals to each other in order to perform an operation. RPC can be used to facilitate an interaction request between COM objects (DCOM RPC) as well as fulfil the interaction request via RPC Methods (functions).
At a high level, RPC breaks down into 3 components:
- Protocol — Defines the communication protocol for which the interaction request is transported. Examples (Directory Replication Service (DRS) RPC, Service Control Manager Remote (SCMR) RPC)
- Interface — “Defines the unique RPC Server to which the communications will be relayed to and defines the set of functions available to the client. Each interface has a universally unique identifier (UUID).
- Methods/OpNums — Another term for functions that will be called to perform a specific behavior.
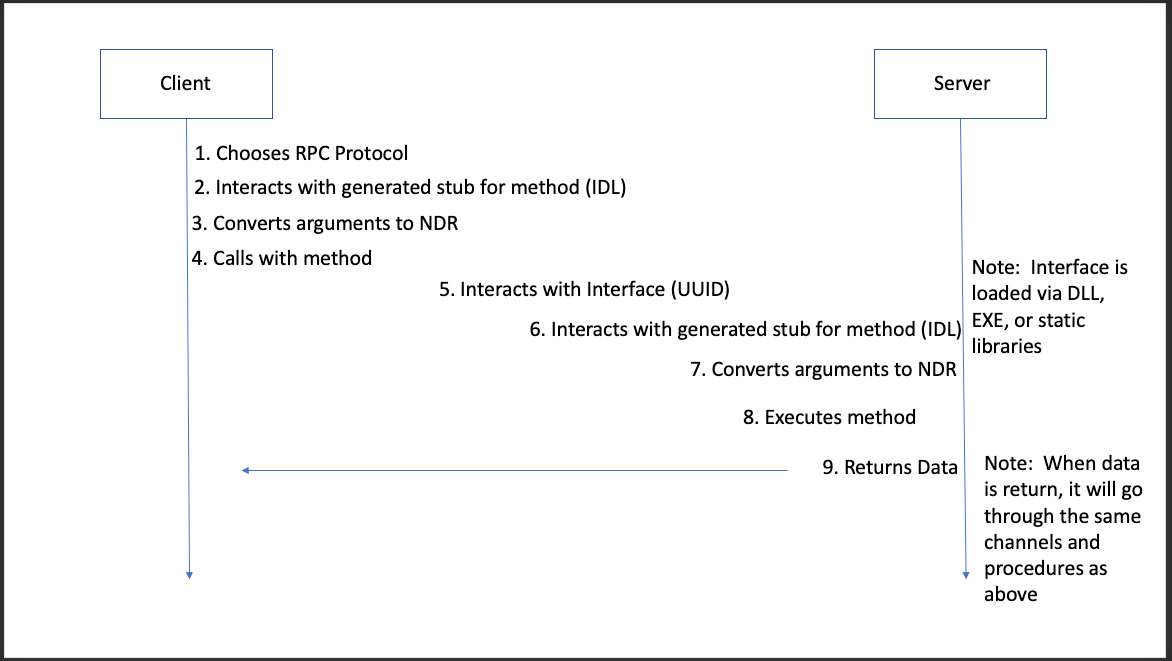
Interfaces and Methods are defined within an IDL (Interface Definition Language) File. Think of this file as a header file. It holds the definition for methods, the parameters the methods can take, the RPC interface’s UUID, and the network transport protocols.
In terms of Microsoft’s Server/Client Framework (which uses the IDL format), there are two ways an RPC Interface can be implemented. .
- Code directly calls the method, which will implement the RPC interface.
- A Win32 API call may implement a client RPC interface underneath, calling an RPC method.
The steps for which RPC is implemented can be found on Microsoft’s Documentation. Below is a diagram I built to show the process:
TLDR;
RPC is an inter-process communication mechanism that is made up of clients and servers. RPC is built to support both local on the same system) and remote requests. There are numerous RPC protocols that facilitate different interactions. Some common examples of RPC protocols are remote registry (MS-RRP), service control manager (MS-SCMR), and the Task Scheduler (MS-TSCH). Generally speaking, servers expose certain functionality through Methods that clients can interact with. If the client is authorized, the server will process the request and execute the method on the clients behalf and return results through the same channel.
Utilizing RPC Data
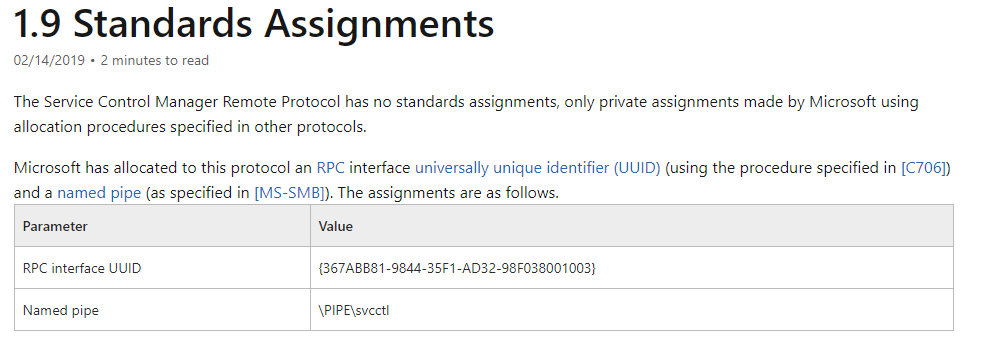
The first thing we want to do is identify if there is a RPC Protocol that is related to service creation. After some initial research and abstraction, we can see there is some Microsoft documentation on Service Control Manager Remote Protocol**. **In the standard assignments section, we observed the static UUID and named pipe associated with this protocol, as shown below. This UUID will be used below in our ETW capture.
Then, we will create an ETW capture against the example above, convert it to EVTX for visibility purposes. We want to do this on the server-side (host you are making the connection to) as it will be the one fulfilling the interaction requests:
logman start Remote-Service-Creation-RPC -p Microsoft-Windows-RPC 0xffffffffffffffff win
-ets
Run the sc.exe example above on the client-side (host requesting the service creation), then run:
logman stop Remote-Service-Creation-RPC -ets
tracerpt Remote-Service-Creation-RPC.etl -o Remote-Service-Creation-RPC.evtx -of EVTX
If we would like to visualize this within a text like format instead, the following can be used:
Get-WinEvent -Path Remote-Service-Creation-RPC.evtx -FilterXPath “*[System[(EventID = 5 or EventID = 6)] and EventData[Data[@Name=’InterfaceUuid’] = ‘367ABB81–9844–35F1-AD32–98F038001003}’]]” | Format-List -Property * | Out-File RPC
EventID’s 5 & 6, will correlate to when a RPC Client/Server call was started. These events are of interest because they will lead us to the methods used within the interaction request. More of why this is of value is explained below.
If we look for the UUID of interest, we come across this log:
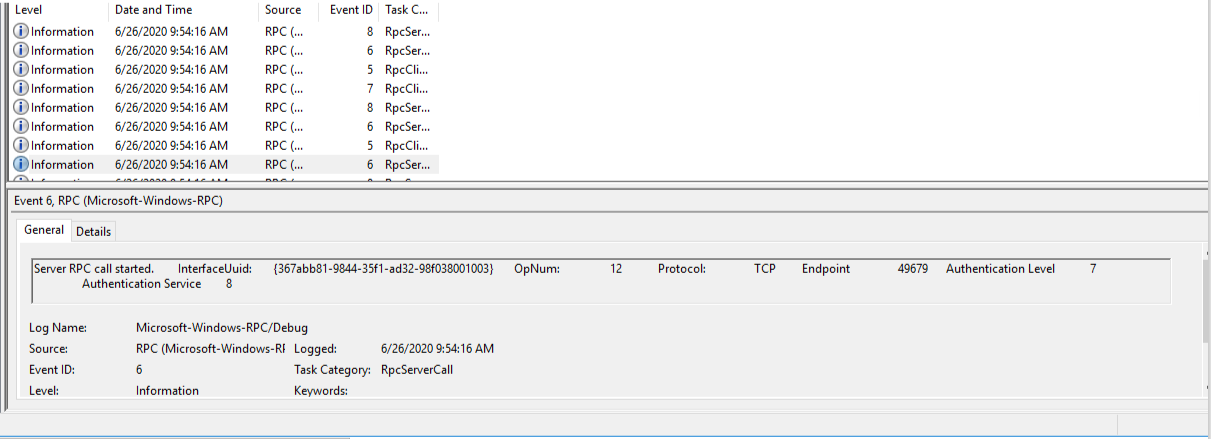
What does this data show us?
- InterfaceUUID
- OpNum # (Method)
- Protocol
- Endpoint port
This data helps us understand what is being performed, but now we want to see the connection is being made from the client to the server. This can be done by running procmon on each host during the time of execution:
Client:

Server:
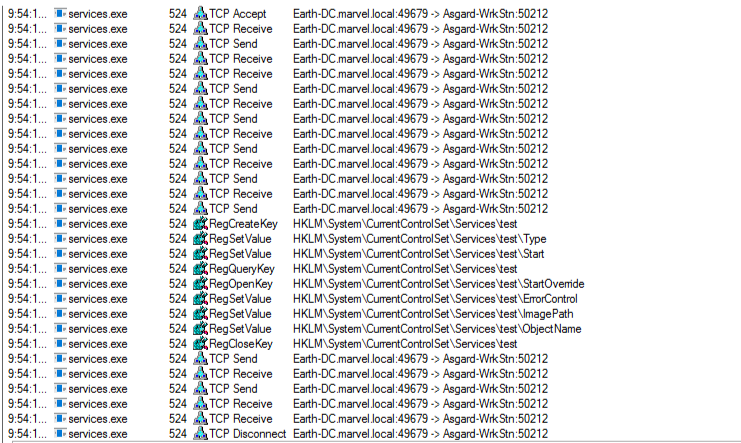
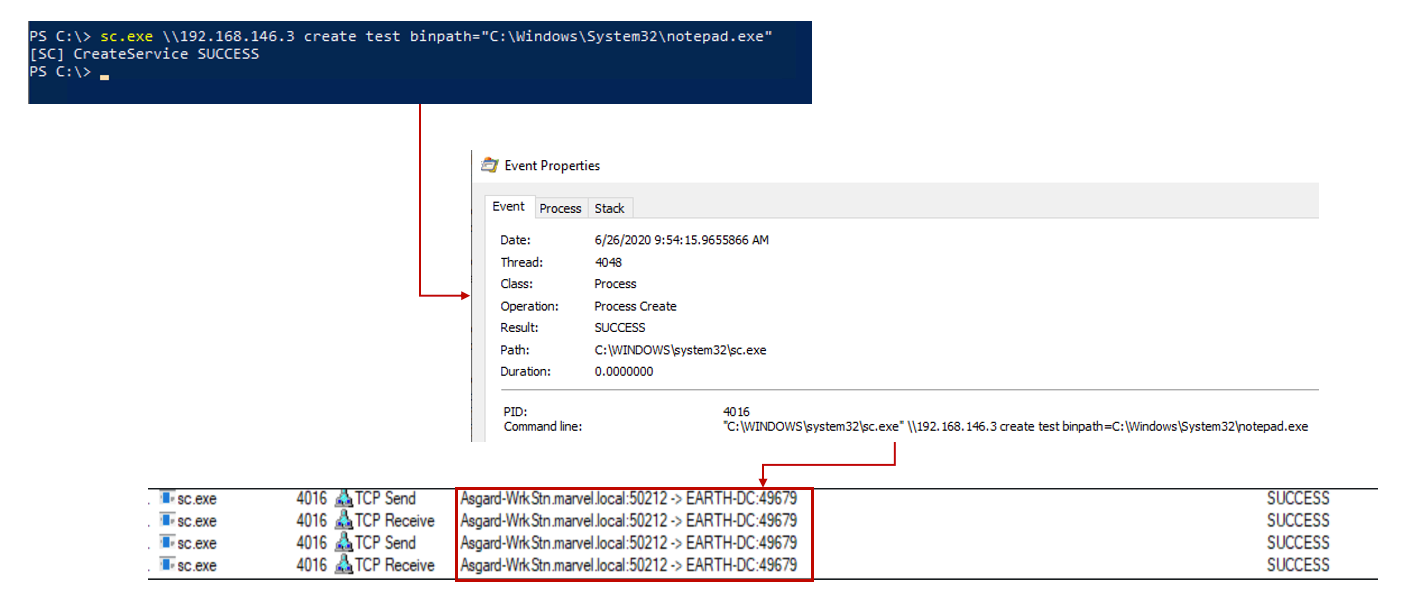
The following actions can be distinguished from the procmon output:
- powershell.exe is spawning sc.exe
- sc.exe is connecting to Earth-DC.marvel.local over port 50212
- services.exe is accepting a connection from Asgard-WrkStn and the destination port is 49679
- The above can be correlated to our ETW Capture.
- The HKLM\System\CurrentControlSet\Services\test Registry Key is created for the new service via services.exe
What does this look like visually?
Client:
Server:
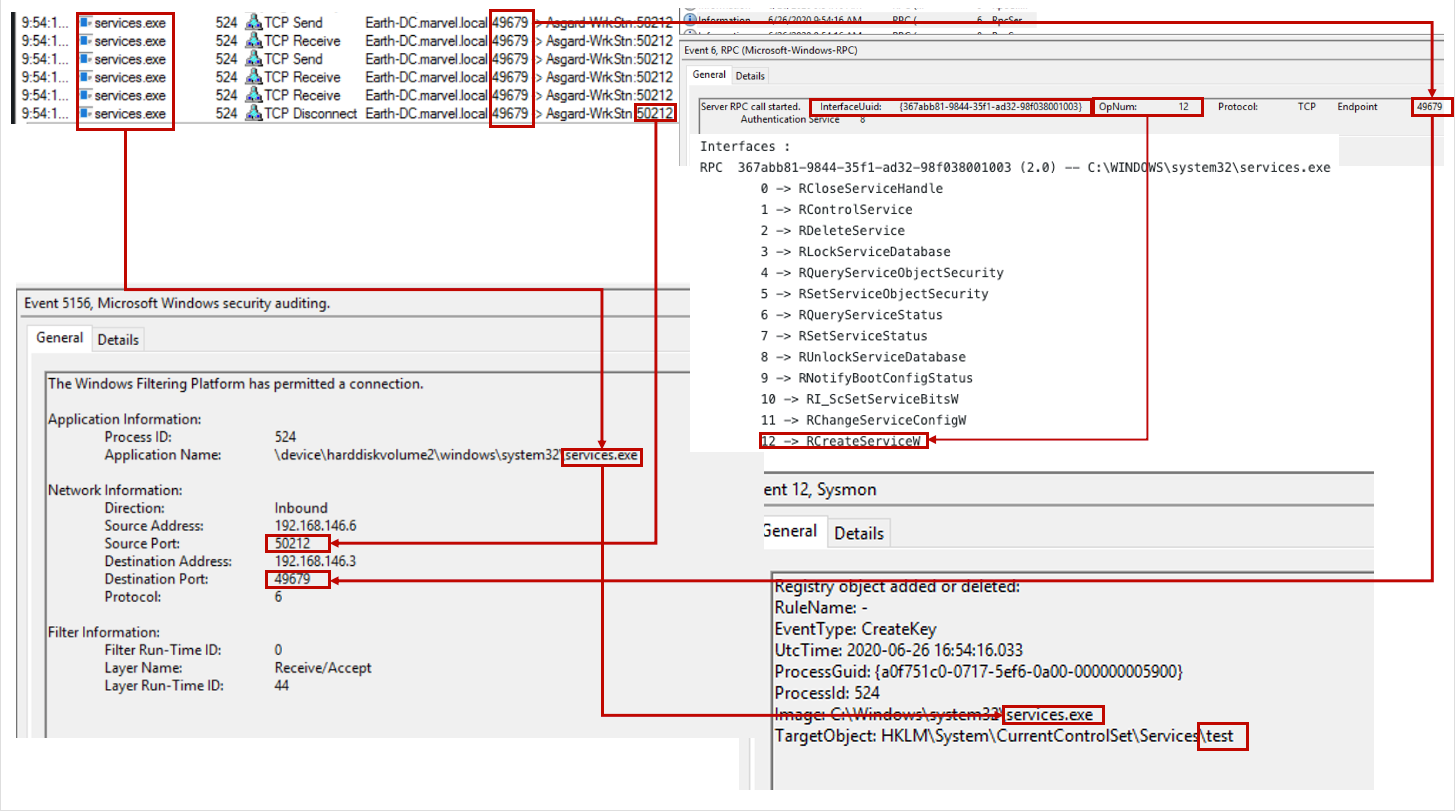
Within this ETW capture, we can see the OpNum is specified. Specific to this use case, the OpNum is 12. This correlates with the RCreateServiceW Method that is called during this RPC connection.
Now that all of this has been identified — what can be used for the actual detection? ETW doesn’t scale, but we’d like to use its visibility into the interface being used and the OpNum being called. Fortunately, Zeek gives us this telemetry:
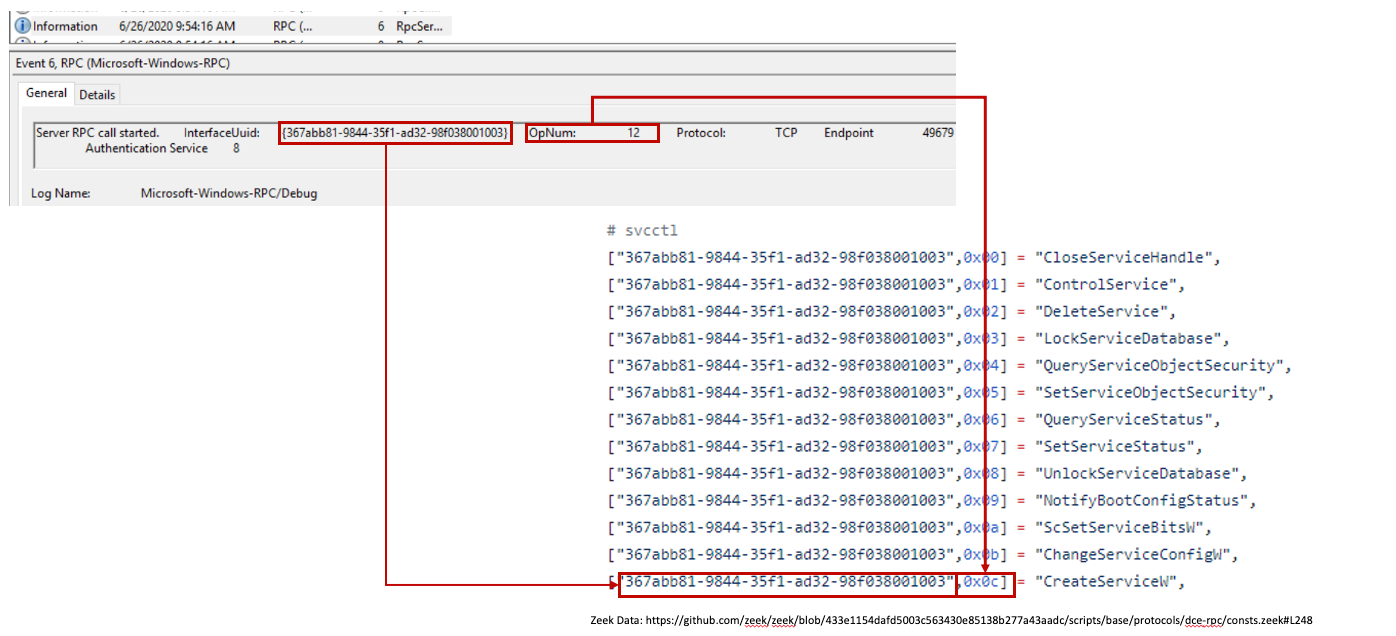
As we can see above, OpNum 12 is used. This equals the hex value of 0x0c from **Zeek’s RPC **logs.
Bringing this all together, let’s identify what coverage we have:
Client-Side (Host-Based):

Server Side (Host-Based):
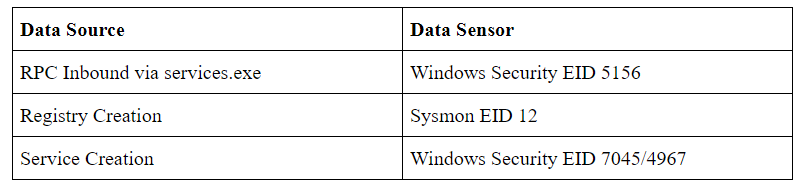
Network-Based:

Wrapping Up
Circling back around, we wanted to answer the second question we have identified at the beginning of this blog — **Question 2: **How can an analyst correlate that service creation event with the client that requested it?
Answer 2: We can accomplish this by bringing data together from both RPC and Registry events and correlating them within a centralized analytic. This can be accomplished by the following Jupyter Notebook:
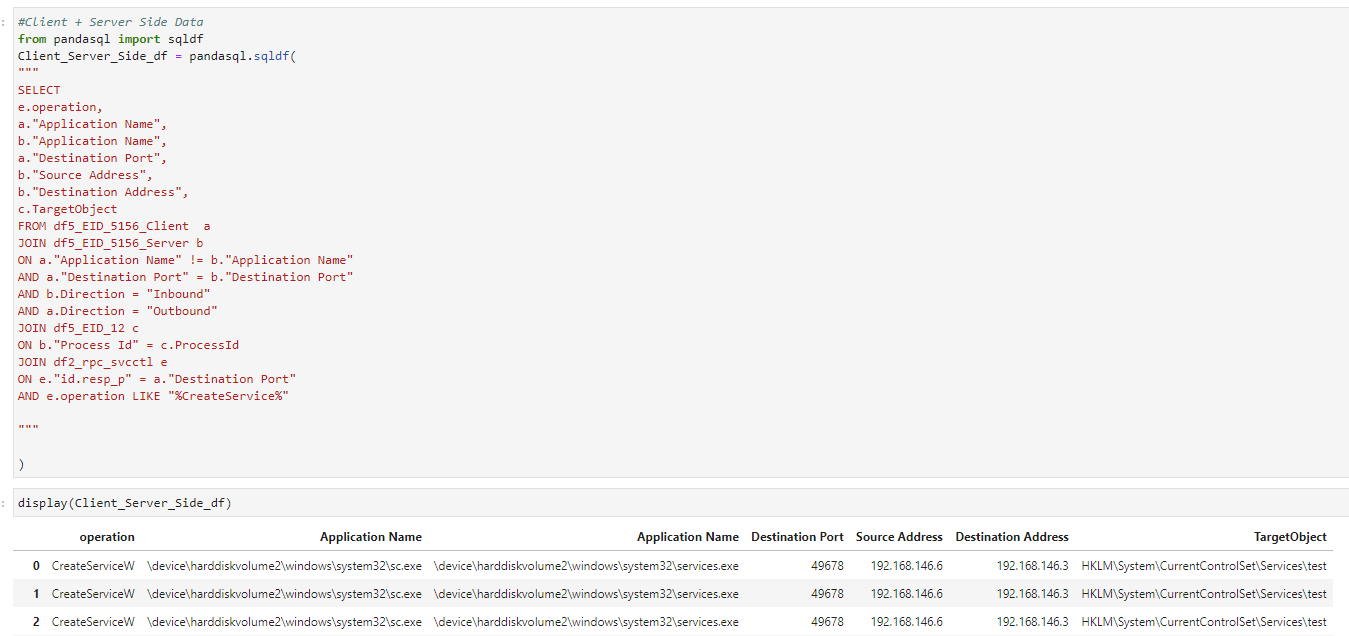
Note: This analytic is not using the service creation event (7045/4967). The pivoting point on this analytic was the registry key creation within Sysmon Event ID 12.
The above gist will contain this notebook, and inside you’ll find 2 analytics:
- Server-side activity by itself
- Client/Server-side activity
Each analytic provides insight into what is happening based on different data attributes.
Conclusion:
This post highlights one of the benefits of using a methodology like capability abstraction during detection engineering efforts. By building an understanding of the components of an attack technique, detection engineers build a foundation that can be called upon to answer new questions. In this case, no one set out to explicitly answer the question of connecting an action to the IPC client, but the abstraction facilitated an easy solution. An added bonus is that many attack techniques rely on similar underlying technology so that the knowledge gained from researching one technique can be applied to a broad spectrum of others. This example shows how uncovering the abstraction layers of an attack technique can be extremely valuable during detection engineering. We hope you can add this analytical process to your detection engineering tool belt to help facilitate more confident and comprehensive detection analytics in the future.